
Probability of success (PoS) in biotech is the estimated likelihood that a drug development program will reach a defined endpoint, most often regulatory approval. The most widely cited benchmark comes from BIO and Citeline: across programs entering Phase I between 2011 and 2020, the overall likelihood of approval (LOA) was 7.9%. That single number reframes every investment thesis in the sector. A portfolio of ten Phase I assets, statistically, yields fewer than one approval.
For investors and sponsors, a PoS figure is not just a probability. It is the discount rate on every future cash flow projection, the threshold for go/no-go decisions, and the denominator in any honest valuation model. Understanding what goes into that number and what distorts it is the difference between a defensible investment case and a hopeful one.
- LOA (Phase I → approval): approximately 7.9% across 2011–2020 programs
- Phase II transition rate: near 28.9%, making it the single largest attrition point
- Practical implication: multiply phase-transition rates sequentially to build a program-level LOA; adjust for therapeutic area, modality, and data vintage before using any benchmark
Key Takeaways
| Point | Details |
|---|---|
| LOA baseline is 7.9% | BIO/Citeline data (2011–2020) puts Phase I to approval likelihood at 7.9% across all therapeutic areas. |
| Phase II is the critical bottleneck | With a ~28.9% transition rate, Phase II is where most programs fail, often for operational rather than biological reasons. |
| Method determines the number | Empirical, path-by-path, and Bayesian approaches yield different PoS estimates; always state which method and data source you used. |
| Bias adjustments are non-optional | Boundary effects, selection bias, and missing registry data inflate naive estimates; use Project ALPHA's bias-adjusted figures or report a range. |
| Haiphai targets operational PoS | Haiphai's embedded partnership model addresses site activation, regulatory drafting, and data quality, the operational levers that move PoS during execution. |
This article is general information, not a substitute for advice from a qualified financial advisor. Consult a qualified financial professional about your own circumstances before acting on anything here.
Table of Contents
- What "probability of success" actually covers in drug development
- How PoS is calculated: from simple multiplication to Bayesian frameworks
- Phase-by-phase benchmarks and how LOA is constructed
- Biases that make naive PoS estimates misleading
- How investors and sponsors use PoS in real decisions
- Operational levers that actually move PoS
- A step-by-step checklist for building a defensible PoS estimate
- Why operational PoS management is the most underrated lever in biotech
- Haiphai helps biotech teams protect and improve their PoS
- Sources
- FAQ
What "probability of success" actually covers in drug development
The term PoS gets used loosely across the industry, and that looseness causes real analytical errors. Before you apply any benchmark, you need to know which definition is in play.
Program-level PoS vs. trial-level PoS
Program-level PoS, often called LOA (Likelihood of Approval), asks: what is the probability this asset reaches regulatory approval from its current development stage? It is path-based, meaning it accounts for all the trials a program must complete to get there. Trial-level PoS is narrower: it asks whether a single trial will meet its prespecified success criterion, typically statistical significance on the primary endpoint.
These two are not interchangeable. A trial can succeed statistically while the program fails commercially or regulatorily. The ASCPT review on PoS in drug development makes this explicit: a defensible PoS must integrate medical, regulatory, technical, and commercial criteria, not just trial-level statistics.
Common synonyms and when each appears
- PoS / POS / P(success): generic terms used across academic and industry contexts
- LOA (Likelihood of Approval): BIO/Citeline's preferred term for program-level, phase-to-approval estimates
- Assurance: Bayesian term for the expected power averaged over a prior distribution on the treatment effect; used in trial design
- PPOS (Predictive Probability of Success): probability a trial will succeed given data observed so far; used in interim analyses
- CPOS (Conditional Probability of Success): probability of success conditional on the true effect being a specific value; closer to classical power
- OPOS (Overall Probability of Success): sometimes used to mean the full path-to-approval probability, synonymous with LOA
Key terms to anchor your reading
Phase transition rate: the fraction of programs that advance from one phase to the next. Path-by-path method: reconstructs individual program histories to estimate transitions, rather than using aggregate counts. Success criterion: the prespecified threshold a trial must clear, which may be statistical significance, a minimum clinically important difference, or a regulatory standard.
How PoS is calculated: from simple multiplication to Bayesian frameworks
Three broad approaches dominate the field. Each has a different data requirement and a different appropriate use case.
Empirical phase-transition multiplication
The simplest method: take the observed fraction of programs that advanced from Phase I to Phase II, multiply by the Phase II to Phase III rate, then by the Phase III to approval rate. The result is an LOA estimate. This is how BIO and Citeline construct their annual reports, and it is the most widely cited approach precisely because it is transparent and reproducible.
The limitation is that it treats all programs within a phase as equivalent. A Phase II oncology asset and a Phase II CNS asset get the same transition multiplier unless you stratify the dataset. Aggregate rates mask enormous heterogeneity.
Path-by-path reconstruction
Rather than counting phase-level aggregates, this method traces individual program histories through Clinicaltrials and commercial databases. Programs with missing intermediate trials are imputed rather than excluded. One peer-reviewed analysis using this approach reported an aggregate POS of 13.8% in its sample, notably higher than the BIO/Citeline LOA, largely because imputation recovers programs that would otherwise appear as failures due to missing registry data. The methodological choice, not the underlying biology, explains much of the difference between published estimates.
Bayesian and predictive approaches
Assurance, PPOS, and related Bayesian methods embed a prior distribution over the treatment effect. Instead of asking "what is the power if the true effect is exactly the assumed value?" they ask "what is the expected probability of success, averaged over plausible effect sizes?"
This distinction matters enormously for Phase II design. Wong et al.'s estimation framework provides the formal statistical machinery underlying many of these calculations.
Choosing the right approach
- Use empirical phase-transition for portfolio-level benchmarking and quick sanity checks
- Use path-by-path when you need program-specific estimates and have access to registry data
- Use Bayesian/assurance for individual trial design decisions and interim go/no-go analyses
Pro Tip: When presenting PoS to a board or investor, state the method explicitly. "Our Phase II LOA is 35%" means nothing without knowing whether that number comes from a therapeutic-area-stratified empirical rate, a path-by-path reconstruction, or a Bayesian assurance calculation. The method is part of the claim.
Phase-by-phase benchmarks and how LOA is constructed
The numbers below come from the BIO/Citeline dataset covering 2011–2020 and represent the most widely cited industry benchmarks for success probability in clinical trials. They are aggregate figures across all therapeutic areas and modalities.
| Development Stage | Transition Rate | Notes |
|---|---|---|
| Phase I → Phase II | 52% | Highest single-phase success rate |
| Phase II → Phase III | ~28.9% | Lowest rate; primary attrition point |
| Phase III → Submission | 57.8% | Reflects late-stage failures and withdrawals |
| Submission → Approval | 85.3% | High once NDA/BLA is filed |
| Phase I → Approval (LOA) | ~7.9% | Multiply all four rates sequentially |
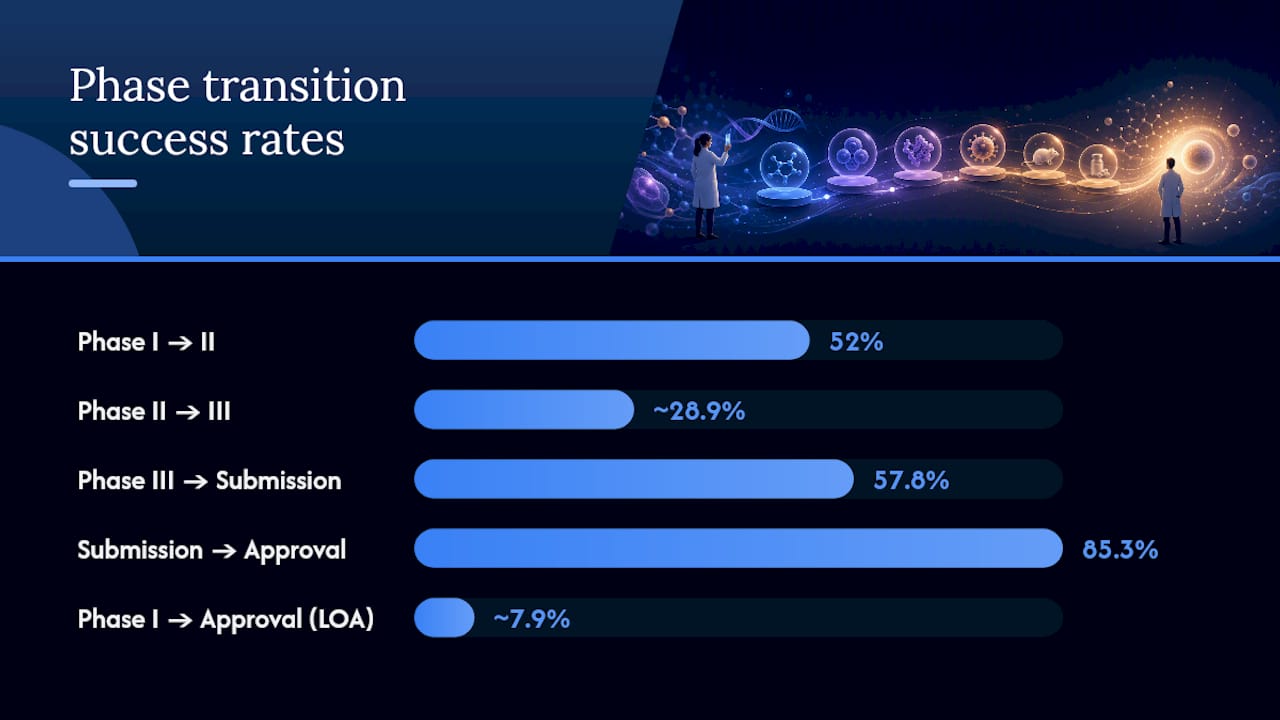
A simple LOA calculation: 0.52 × 0.289 × 0.578 × 0.853 ≈ 0.074, or roughly 7.4%, close to the reported 7.9% (rounding and dataset-specific adjustments account for the small difference).
The Phase II bottleneck
Phase II is where most programs die, and the reasons are well understood: underpowered trials, optimistic effect-size assumptions, poorly validated biomarkers, and inadequate patient selection. A Nature Communications analysis of dynamic success rate trends documents that overall success rates have declined over recent decades, with Phase II attrition a consistent driver.

Therapeutic-area variation
Hematology and infectious disease have historically carried higher LOAs than oncology or CNS. Oncology's LOA sits well below the aggregate benchmark, while hematology has exceeded it. CNS programs face particularly high Phase II failure rates due to the difficulty of translating preclinical signals and the complexity of endpoint selection. Any benchmark you apply to a specific program should be stratified by therapeutic area, not taken from the aggregate.
A note on data vintage
Benchmarks from a 2011–2020 window do not capture the performance of newer modalities like cell and gene therapies, ADCs, or RNA-based drugs. Apply aggregate LOA figures to novel modalities with caution. Recent-year snapshots also carry a boundary effect (discussed in the next section) that inflates apparent success rates for the most recent cohorts.
Biases that make naive PoS estimates misleading
Raw phase-transition rates, taken at face value, routinely overstate or understate true PoS. Knowing which direction the bias runs, and by how much, is what separates a defensible estimate from a number that sounds precise but isn't.
The boundary effect
Programs that entered Phase I in, say, 2022 have not yet had time to complete all development phases. If you calculate a transition rate using recent-year data, programs that are still active look like successes (they haven't failed yet), inflating the apparent rate. Project ALPHA at MIT explicitly corrects for this by computing bias-adjusted PoS estimates alongside unadjusted time-series visualizations, with upper and lower bounds. Any recent-year PoS figure without a boundary-effect correction should be treated as an upper bound, not a central estimate.
Selection and publication bias
- Sponsors are more likely to register and report trials that succeed; failures are underreported in public registries
- Programs that advance to Phase III are not a random draw from Phase II entrants; they are the survivors of internal go/no-go filters, which inflates observed Phase III success rates relative to what an unselected Phase II cohort would produce
- Academic publications disproportionately report positive trial results, skewing the literature used to calibrate Bayesian priors
Surrogate endpoints
A Phase II trial that succeeds on a biomarker endpoint does not guarantee Phase III success on a clinical outcome. Surrogate-to-clinical translation failures are a documented source of Phase III attrition, particularly in oncology and cardiovascular disease. When building a PoS estimate from Phase II data, the nature of the Phase II endpoint matters as much as whether the trial succeeded.
Missing trial data
ClinicalTrials.gov is the primary source for path-by-path reconstructions, but registry completeness is imperfect. Programs with missing intermediate trials can appear to jump phases or disappear, introducing noise into transition-rate calculations. The path-by-path method addresses this through imputation, but imputation assumptions themselves introduce uncertainty.
Pro Tip: Always report PoS as a range, not a point estimate. A central estimate of 25% with a lower bound of 15% and an upper bound of 38% is far more useful to a decision-maker than "25%." The width of the range communicates how much the estimate depends on assumptions.
The BIO/Citeline LOA of 7.9% is itself a central estimate. Depending on therapeutic area, modality, and data vintage, a program's true LOA could be meaningfully higher or lower.
How investors and sponsors use PoS in real decisions
PoS is not a number you calculate and file away. It enters directly into the financial and strategic machinery of drug development.
Probability-weighted NPV
The standard valuation model for a drug asset discounts projected peak sales by the probability of reaching each milestone. A simplified structure:
- Estimate peak annual revenue if approved
- Apply phase-specific PoS to each cash flow stream (Phase II success × Phase III success × approval probability)
- Discount to present value using a risk-adjusted discount rate
- Subtract development costs, also probability-weighted
The PoS assumption drives the valuation more than the revenue forecast in early-stage assets. For a deeper look at how these assumptions feed into biotech company valuation, the interaction between PoS and discount rate is the most sensitive variable.
Go/no-go thresholds
Different organizations set different PoS thresholds for advancing a program. A single-asset biotech cannot afford the same logic; their threshold is effectively existential. Biotech resource allocation frameworks that ignore this distinction routinely misallocate capital.
Portfolio-level use
- Calculate expected value (EV) for each asset: EV = PoS × net present value if successful
- Rank assets by EV and by strategic fit
- After a phase readout, update PoS for all remaining assets using the new information (Bayesian updating)
- Reallocate capital toward higher-EV assets and away from those whose PoS dropped materially
Documenting PoS assumptions for investors and boards
- State the data source (BIO/Citeline, Project ALPHA, internal analysis)
- State the method (empirical, path-by-path, Bayesian)
- State the therapeutic-area and modality stratification applied
- Provide upper and lower bounds, not just a central estimate
- Note the vintage of the underlying data and any boundary-effect adjustments
Pro Tip: When presenting PoS-driven decisions to nontechnical stakeholders, lead with the implication, not the method. "We have a one-in-four chance of reaching approval from here, and here is what that means for our runway and our next financing round" lands better than a methodology walkthrough. Save the technical detail for the appendix.
Operational levers that actually move PoS
Most PoS discussions focus on the biology. The operational side gets far less attention, which is exactly why it is where the leverage is. Operational bottlenecks in Phase II, particularly site activation delays, enrollment problems, and data quality failures, are documented drivers of program termination. These are not statistical problems. They are process problems.
- Site activation speed: delays between protocol finalization and first patient enrolled compress the data collection window, increase dropout risk, and raise per-patient costs. Faster site activation directly reduces the probability of a trial failing for operational rather than scientific reasons.
- Enrollment velocity: underpowered trials are a leading cause of Phase II failure. Slow enrollment forces sponsors to either extend timelines (burning cash) or accept a smaller-than-planned sample (reducing power and, therefore, PoS).
- Data completeness and quality: missing or inconsistent data at interim analyses distorts PPOS calculations and can trigger unnecessary early terminations or, worse, mask a genuine signal.
- Early regulatory alignment: programs that engage FDA through Pre-IND meetings and Type B meetings before Phase II design lock in endpoint definitions that regulators will accept. A Phase II that succeeds on an endpoint the FDA later rejects is a Phase II failure for all practical purposes.
- Protocol design discipline: overly complex protocols inflate screen failure rates and reduce the representativeness of the enrolled population, both of which affect Phase III generalizability and, ultimately, approval probability.
- Capital allocation timing: underfunding Phase I operational infrastructure to save money routinely costs more in Phase II, where the consequences of poor data quality and weak site networks compound. Early investment in biotech timeline management pays dividends in later-phase PoS.
Haiphai's operational diagnostics are specifically designed to identify which of these levers is most constrained for a given program, and to redesign the workflows around them before they become Phase II attrition events.
A step-by-step checklist for building a defensible PoS estimate
Whether you are producing a PoS estimate for internal go/no-go decisions or presenting one to investors, the process should be reproducible and documented.
- Define the success criterion explicitly. Is success regulatory approval? Phase transition? A specific clinical outcome threshold? The criterion determines which historical data is comparable.
- Select a reference dataset. Choose BIO/Citeline for aggregate benchmarks, Project ALPHA for bias-adjusted time-series, or a custom dataset from ClinicalTrials.gov for path-by-path work. Document the source and vintage.
- Stratify by therapeutic area and modality. Never apply an aggregate LOA to a specific program without stratification. Oncology, CNS, and rare disease each carry materially different transition rates.
- Choose a calculation method. Empirical multiplication for portfolio benchmarking; path-by-path for program-specific estimates; Bayesian assurance for trial design decisions.
- Apply bias adjustments. Correct for the boundary effect in recent-year data. Apply upper and lower bounds to reflect selection bias and missing data uncertainty.
- Incorporate non-statistical factors. Regulatory pathway (standard vs. accelerated approval, Breakthrough Therapy designation), competitive landscape, and commercial viability all affect the probability that a technically successful program reaches approval. The ASCPT framework formalizes this multifactorial approach.
- Set the minimum evidence bar for Phase II to Phase III advancement. At minimum: a statistically significant or clinically meaningful primary endpoint result, a safety profile consistent with the target population, and a regulatory pathway confirmed through FDA engagement.
- Run sensitivity scenarios. What does the PoS look like if the Phase II effect size is 20% smaller than observed? What if the Phase III trial requires a larger sample? Scenario analysis converts a point estimate into a decision-relevant range.
- Document assumptions and version the estimate. PoS estimates should be updated after every major data readout. Version control prevents the common error of presenting a stale estimate as current.
- Report upper and lower bounds alongside the central estimate. A range communicates epistemic honesty and is more defensible under investor scrutiny than a single number.
Pro Tip: If your program is novel enough that no historical comparator exists (a first-in-class mechanism in an underserved indication), commission an independent PoS review from a group with access to proprietary datasets. An internally generated PoS for a truly novel asset is almost always anchored too high.
Why operational PoS management is the most underrated lever in biotech
The industry spends enormous energy debating which biological hypotheses are most likely to succeed and relatively little time on the operational execution that determines whether a trial actually tests the hypothesis cleanly. That asymmetry is a mistake.
These are not inevitable. They are the product of process gaps that are identifiable and correctable before a trial starts.
The implication for investors is direct: a program's PoS is not fixed at the moment of Phase I entry. It is a dynamic variable that operational decisions move, in both directions, throughout development. A team that activates sites faster, maintains cleaner data, and engages regulators earlier is running a materially different PoS trajectory than one that treats operations as a back-office function. Understanding why biotech companies miss milestones is, at its core, understanding why PoS degrades during execution rather than at the biology stage.

The honest version of a PoS estimate accounts for this. It is not just a function of the therapeutic area and the mechanism of action. It is a function of the team, the process, and the operational infrastructure behind the trial.
Haiphai helps biotech teams protect and improve their PoS
Knowing your PoS benchmark is one thing. Executing the operations that keep it from degrading during Phase II is another. Haiphai works as an embedded operational partner for biotech and life sciences teams, starting from your program's strategic goals and mapping backward to find where process gaps are most likely to cost you a phase transition.
The work covers the levers that move PoS in practice: regulatory drafting automation that reduces submission cycle times, clinical site activation workflows that compress the gap between protocol lock and first patient enrolled, and AI-enabled data quality monitoring that catches completeness problems before they distort interim analyses. Clients have reclaimed up to 18 months of operational time on the path to approval, a figure that compounds directly into valuation and funding outcomes.
If your program is approaching a Phase II readout or a Phase III design decision, the time to address operational gaps is before the trial starts, not after the data comes in. Explore Haiphai's operational partnership model to see where the leverage is in your specific program.
Sources
The quality of a PoS estimate is bounded by the quality of its data source. These are the sources worth knowing.
- Clinical Development Success Rates and Contributing Factors 2011–2020
- Estimates of Clinical Trial Probabilities of Success (PoS) – Project ALPHA
- PMC article on POS estimation (Biostatistics-related study)
- Probability of Success in Drug Development
- Clinicaltrials
A practical note: BIO/Citeline and Pharmaprojects are commercial sources. Project ALPHA and ClinicalTrials.gov are public. For most biotech teams, combining the public sources with the BIO annual reports (which are freely downloadable) covers the majority of benchmarking needs. Proprietary database access becomes worth the cost when you need program-level granularity or therapeutic-area-specific stratification beyond what the public reports provide.
FAQ
What does probability of success mean in biotech?
Probability of success (PoS) in biotech is the estimated likelihood that a drug development program will reach a predefined endpoint, typically regulatory approval, from its current development stage. It is calculated by multiplying phase-transition rates sequentially, adjusted for therapeutic area, modality, and methodological choices.
What is the typical LOA for a Phase I drug?
What is the probability of pharmacological success?
Pharmacological success refers to a drug demonstrating the intended biological effect in humans, which is a necessary but not sufficient condition for regulatory approval. A program can achieve pharmacological success in Phase II and still fail Phase III due to insufficient clinical meaningfulness, safety issues, or endpoint misalignment with regulators.
Why do 90% of clinical trials fail?
The commonly cited figure reflects the aggregate LOA across all development stages. Biology is one cause; execution is another.
How does therapeutic area affect PoS?
PoS varies substantially by indication. Hematology and infectious disease have historically carried higher LOAs than the aggregate benchmark, while oncology and CNS programs sit below it. A Nature Communications analysis documents this variation and shows it has shifted over time, which is why applying a single aggregate LOA to a specific program without stratification produces unreliable estimates.