
TL;DR:
- Effective biotech resource allocation frameworks treat capital deployment as a dynamic, milestone-driven process linked to potential value, success probability, and costs to milestones. They incorporate criteria such as scientific merit, regulatory feasibility, commercial viability, and competitive positioning, often augmented by AI to provide better data for decision-making. Utilizing decision scores, scenario planning, and portfolio construction helps teams allocate capital effectively, extend runway, and manage binary risks across programs.
What are the most effective biotech resource allocation frameworks?
The most effective biotech resource allocation frameworks treat capital deployment as a dynamic, milestone-driven exercise rather than a fixed annual budget. They quantify three variables for every program: potential value, probability of technical and regulatory success, and cost to the next meaningful milestone. Frameworks built around these inputs consistently outperform department-centric budgeting because they force a direct link between spending and value creation events.
Key elements every allocation framework should address:
- Scientific merit: Does the underlying biology hold up under scrutiny?
- Regulatory feasibility: Can the program realistically meet FDA requirements within the planned timeline?
- Commercial viability: Is the market opportunity large enough to justify the capital at risk?
- Competitive positioning: What does the asset offer that existing or pipeline therapies do not?
- Financial constraints: How does each funding decision affect cash runway?
AI now plays a real role in synthesizing these dimensions. Predictive analytics can model scenario outcomes faster than any spreadsheet team, and AI in regulatory affairs has become one of the clearest augmentation stories in the sector. The goal is not to replace judgment but to give leadership teams better data before they commit capital.
1. How the Decision Score framework guides program prioritization
The Decision Score framework gives biotech teams a single comparable metric across programs with very different risk and reward profiles.
The formula:
Here is how each component works in practice:
- Potential Value is an illustrative exit or licensing value based on comparable acquisitions or market size estimates. It does not need to be a full discounted cash flow model at the early stage.
- Probability of Technical and Regulatory Success (PTRS) quantifies the likelihood of advancing from the current stage to the next. Grounding PTRS estimates in public success-rate data from sources like BIO's Clinical Development Success Rates reduces subjective bias.
- Cost to Milestone covers fully loaded direct costs: CRO contracts, manufacturing, scientist salaries, and lab supplies. It is not the total cost to market.
A hypothetical comparison makes the logic concrete. Program A has a $200M potential value, 40% PTRS, and $10M cost to milestone, yielding a score of 8.0. Program B has a $100M value, 60% PTRS, and $5M cost, also scoring 12.0. Program C scores 2.0. Programs A and B both warrant funding conversations; Program C needs a strategic rationale beyond its raw score before capital flows to it.
The Decision Score works precisely because it is simple enough for a board conversation but rigorous enough to replace gut feel. Early-stage biotechs rarely have the bandwidth for full risk-adjusted NPV models, and this framework delivers most of the value at a fraction of the effort.

2. How scenario planning helps you avoid the sunk cost trap
Sunk cost fallacy is one of the most expensive cognitive biases in biotech. Teams continue funding low-probability programs because of prior investment rather than future potential. Scenario planning breaks that pattern by shifting the question from "how much have we spent?" to "what does the next dollar actually buy us?"
Three scenario types every biotech team should model:
- Baseline scenario: All current programs funded at proposed levels. This immediately surfaces your default cash-out date, which is often shorter than leadership expects.
- Cut scenario: Deactivate costs for the lowest-ranked program. The model recalculates burn rate and shows exactly how many months of runway you recover.
- Reallocation scenario: Pause one project and move a scientist to another. This captures nuance beyond a binary go or no-go decision.
Separating direct program costs from overhead is the prerequisite step. Do not allocate portions of the CEO's salary or office rent to individual programs at this stage. Focus on variable, program-specific spend: headcount directly assigned to the program and external vendor contracts.
Pro Tip: Run all three scenarios before any board funding discussion. The reallocation scenario almost always surfaces an option that leadership had not considered, and it shifts the conversation from "which program survives?" to "how do we sequence these assets for maximum runway?"
3. Why portfolio construction is your primary risk management tool
Binary clinical outcomes are a structural feature of private biotech, not an anomaly. A failed readout can render a program nonviable overnight, which is why portfolio construction functions as the primary risk management mechanism rather than a secondary consideration.
"Because individual private biotech outcomes are difficult to predict, portfolio construction becomes a primary risk-management tool. Key decisions include number of portfolio investments, position sizing, whether to tranche investments via milestones, and aggregate exposure by therapeutic area or modality." — Wellington Management
Portfolio construction decisions that directly affect resource allocation:
- Number of investments: Broader exposure reduces the impact of any single binary failure.
- Position sizing: Larger positions in higher-conviction, later-stage assets; smaller tranches for earlier, higher-risk programs.
- Milestone-based tranching: Release capital in stages tied to data readouts rather than calendar quarters. This preserves runway and maintains optionality.
- Therapeutic area and modality diversification: Correlation between programs matters. Two oncology programs using the same mechanism of action carry correlated failure risk.
The practical payoff is smoother cash flow and a better negotiating position at the next financing round. A team that reaches a meaningful data readout with runway to spare negotiates from strength.
4. Integrating scientific, regulatory, commercial, and competitive pillars with AI
A systemic framework built around four interrelated pillars produces better risk-adjusted decisions than any single-dimension analysis. The four pillars are scientific merit, regulatory feasibility, commercial viability, and competitive positioning. Integrating them forces cross-functional alignment between R&D, finance, and strategy teams.
| Pillar | Key question | AI contribution |
|---|---|---|
| Scientific merit | Is the biology sound and reproducible? | Literature synthesis, target validation modeling |
| Regulatory feasibility | Can the program meet FDA standards on this timeline? | Precedent analysis, submission gap detection |
| Commercial viability | Does the market justify the capital at risk? | Pricing model benchmarking, payer landscape analysis |
| Competitive positioning | What does this asset offer that alternatives do not? | Competitive intelligence aggregation |
AI's role is not to answer these questions but to compress the time it takes to gather the evidence. Predictive analytics can model how a change in one pillar, say a competitor's Phase 3 readout, ripples through commercial viability assumptions. Case studies from AstraZeneca and Eli Lilly illustrate how systemic approaches enhance portfolio resilience and decision quality through cross-functional governance.
Steps to adopt this framework:
- Map each program against all four pillars before any funding decision.
- Assign a cross-functional owner to each pillar, not just the scientific lead.
- Use AI tools to update pillar assessments at each milestone gate, not annually.
- Document the rationale for every allocation decision so postmortems are possible.
5. How Haiphai's operational model puts these frameworks into practice
Haiphai operates as an operational partner rather than a software vendor. The distinction matters: Haiphai starts from your strategic goals and works backward to identify where bottlenecks are consuming time and capital, then deploys AI to address those specific points.
Haiphai clients reclaim up to 18 months of operational time on regulatory and clinical milestones through AI-driven process efficiencies. Those months translate directly into valuation and funding leverage, since a company that reaches its next data readout ahead of schedule negotiates its next round from a materially stronger position.
Pro Tip: Capital allocation belongs in the C-suite, not delegated to finance alone. CEO-level ownership of funding decisions ensures they reflect long-term strategic vision rather than short-term cost pressure. Haiphai's frameworks are designed to support that ownership with data, not to replace the judgment that only leadership can provide.
The operational model for a 50-person biotech that Haiphai supports is built around the same principles: milestone-driven budgeting, AI-augmented regulatory drafting, and clinical site activation processes that compress timelines without adding headcount.
How to estimate and manage timelines within your allocation framework
Timeline estimation fails most often when teams conflate calendar time with milestone time. A program does not advance because a quarter passed; it advances when a specific data event occurs. Milestone-based budgeting, which links spend directly to value inflection points, forces more honest timeline construction.
Practical steps for better estimates: anchor each milestone to a specific deliverable (IND filing, Phase 1 completion, preclinical data package), assign a probability-weighted duration range rather than a point estimate, and build a buffer tied to the program's PTRS. Lower-probability programs carry higher timeline variance and should be budgeted accordingly. Dynamic resource allocation models that treat resource profiles as flexible, rather than fixed, improve both pipeline profitability and schedule accuracy.
Connecting timeline estimates to cash runway is the final step most teams skip. Every milestone delay extends burn without extending value, so the allocation framework must update runway projections automatically when timelines shift.
Operational efficiency techniques that actually move the needle in biotech
The highest-leverage efficiency gains in biotech come from compressing the time between decision and action, not from cutting costs. Milestone-driven budgeting rather than department-centric approaches links spend directly to value inflection points, which eliminates the lag between a data readout and a reallocation decision.
Three techniques with outsized impact:
- Centralized program cost tracking: Separate program-specific spend from overhead from day one. Teams that do this in their accounting system (using project tags in QuickBooks or Xero) spend far less time reconstructing costs when a prioritization decision is needed.
- AI-assisted regulatory drafting: Regulatory submissions are among the most time-intensive activities in biotech. AI tools that detect gaps in draft submissions before they reach the FDA reduce revision cycles and protect timeline estimates. AI-driven regulatory risk detection is now a practical option for teams of any size.
- Adaptable spreadsheet models over rigid enterprise software: Early-stage biotechs consistently get more value from well-designed spreadsheet models than from complex enterprise platforms. Spreadsheets allow faster scenario adjustments and closer tracking of milestone-based budgets.
How US regulatory requirements should shape your resource allocation decisions
FDA timelines are not just compliance checkpoints; they are capital allocation inputs. Every IND, NDA, or BLA submission carries a cost and a probability of success that belongs in your Decision Score calculation. Teams that treat regulatory milestones as external events rather than internal planning variables consistently underestimate both cost and timeline.
The FDA's PDUFA review clock (typically 10 or 12 months for standard or priority review) sets a hard constraint on when a program can generate its next value inflection point. Allocating resources without accounting for that clock means funding programs that cannot produce a fundable milestone within your runway. Regulatory feasibility, including the realistic probability of FDA acceptance at each stage, belongs in the pillar assessment before capital is committed, not after a Complete Response Letter arrives.
Teams navigating the FDA's AI and regulatory affairs intersection are finding that AI-assisted submission preparation reduces the gap between a data readout and a submission-ready package, which directly compresses the time between milestone and value creation.
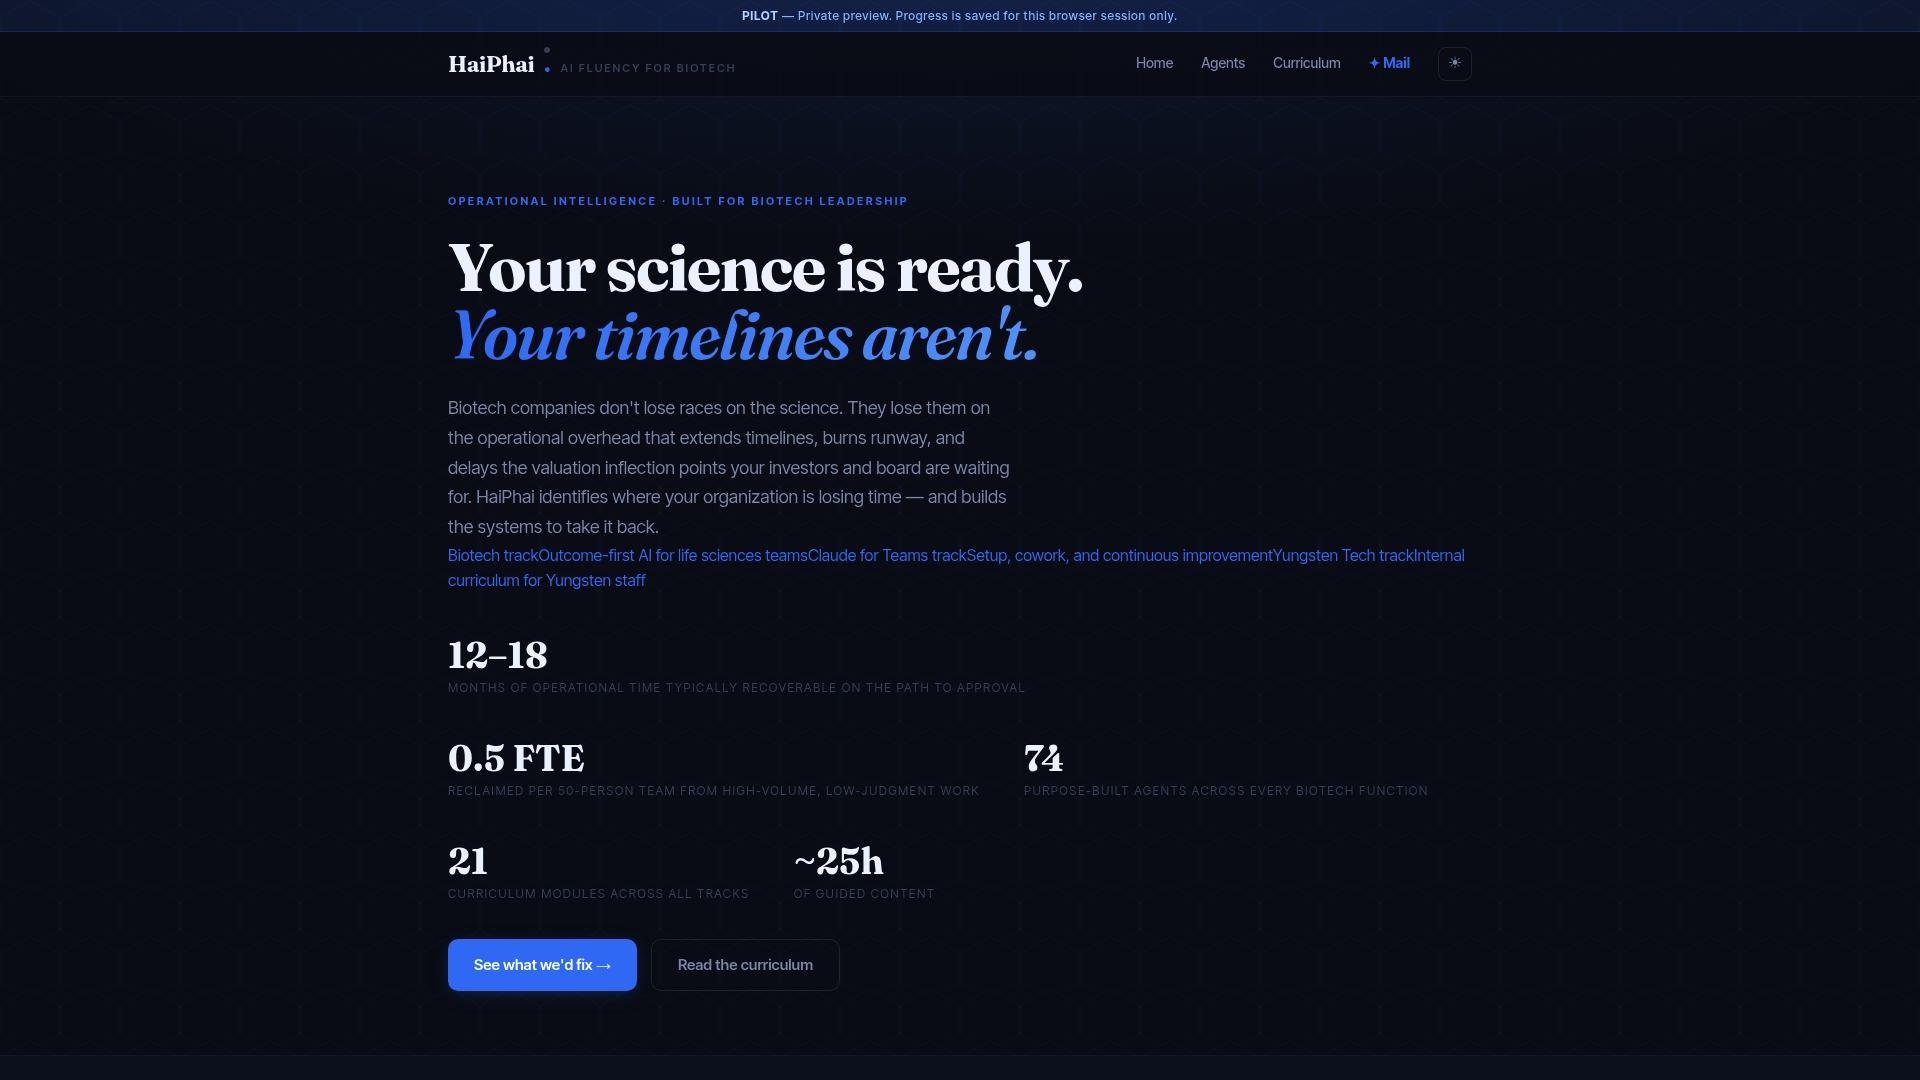
Haiphai works with biotech teams to translate these frameworks into operational reality, from regulatory drafting to clinical site activation. If your current allocation process is still tied to annual budgets rather than milestones, explore Haiphai's solutions or see which sectors Haiphai serves to find where the fit is strongest.
Key Takeaways
Effective biotech resource allocation requires milestone-driven capital deployment, quantified by Decision Score, stress-tested through scenario planning, and protected by portfolio construction across programs and modalities.
| Point | Details |
|---|---|
| Decision Score drives prioritization | Score = (Potential Value × PTRS) / Cost to Milestone; compare programs on this metric before committing capital. |
| Scenario planning extends runway | Modeling baseline, cut, and reallocation scenarios can reveal months of additional runway without cutting core programs. |
| Portfolio construction manages binary risk | Diversify across therapeutic areas, size positions by conviction, and tranche funding to milestones to reduce single-program exposure. |
| Four pillars improve decision quality | Integrating scientific merit, regulatory feasibility, commercial viability, and competitive positioning produces better risk-adjusted outcomes. |
| Haiphai clients reclaim up to 18 months | AI-driven operational efficiencies on regulatory and clinical milestones translate directly into valuation and funding leverage. |
FAQ
What is a Decision Score in biotech resource allocation?
The Decision Score equals Potential Value multiplied by Probability of Technical and Regulatory Success, divided by Cost to Milestone. It gives teams a single comparable metric to rank competing programs without a full risk-adjusted NPV model.
How does scenario planning prevent sunk cost errors?
Scenario planning models the cash runway impact of cutting or reallocating a program, making the future cost of continuing a low-probability asset visible and separating that decision from prior investment already spent.
Why does portfolio construction matter for biotech resource management?
Biotech clinical outcomes are often binary, meaning a single failed readout can destroy an asset's value overnight. Portfolio construction across programs, stages, and modalities is the structural response to that risk.
When should a biotech use a spreadsheet model versus enterprise software?
Early-stage biotechs typically get more value from adaptable spreadsheet models because they allow faster scenario adjustments and closer milestone-based budget tracking than rigid enterprise platforms.
How do US FDA timelines affect resource allocation decisions?
FDA review clocks (10 or 12 months for standard or priority review) set hard constraints on when a program can generate its next value inflection point, making regulatory feasibility a required input in any allocation framework before capital is committed.