
Biotech company valuation is defined by the expected present value of a future drug pipeline, adjusted for the probability that each asset survives clinical and regulatory review. This is not a revenue multiple exercise. Pre-revenue biotechs live and die by risk-adjusted net present value, known as rNPV, a model that weights cash flow forecasts against the real odds of FDA approval at each clinical phase. To maximize biotech company valuation, executives must attack the inputs that rNPV is most sensitive to: time-to-cashflow, clinical success probability, and capital efficiency. Operational delays, weak IP positioning, and poor transaction readiness each compress valuation in ways that are measurable, predictable, and preventable.
How is biotech company valuation calculated?
rNPV combines three components: forecasting future cash flows from a drug asset, discounting those flows to present value, and adjusting the result for the probability of clearing each clinical and regulatory hurdle. The discount rate in biotech is high because the risk is high. Every additional month of delay compounds that discount, shrinking the present value of future earnings.
Pre-revenue biotechs cannot rely on revenue multiples or EBITDA comparisons. rNPV is the standard for 409A valuations, with clinical phase serving as the primary value driver. A Phase I asset carries a fraction of the value of a Phase III asset, even if the underlying science is identical, because the probability of approval rises sharply with phase completion.
Operational delays reduce rNPV by pushing cashflow further into the future, where the discount rate erodes it more aggressively. Shortening time-to-cashflow is not merely a cost-cutting exercise. It is a direct valuation driver. A company that reaches a Phase III readout six months earlier than a competitor carries a materially higher present value, all else equal.
Key rNPV inputs that executives should monitor:
- Clinical success probability at each phase, updated after each data readout
- Time-to-peak-sales, driven by regulatory timelines and commercial readiness
- Discount rate, reflecting both market risk and company-specific execution risk
- Peak revenue forecast, shaped by market size, pricing assumptions, and competitive positioning
Pro Tip: Map your schedule-linked downside risk quarterly. Model the rNPV impact of a three-month, six-month, and twelve-month delay at each upcoming milestone. The output forces honest conversations about which operational bottlenecks carry the most financial consequence.
What operational strategies accelerate clinical trial timelines?
Median Phase II site activation stretches to 9–15 months post-pandemic. Structural investments can compress that window to 4–6 months. That difference represents the single largest controllable variable in a biotech's path to a Phase II readout, and therefore one of the largest levers for increasing company worth.
The causes of activation delay are well documented and largely preventable:
- Contract negotiation backlogs. Site contracts and budget negotiations frequently stall for weeks when legal and finance teams are not engaged early. Sponsors that pre-negotiate master agreements with preferred site networks cut this phase dramatically.
- IRB queue times. Institutional review board submissions that arrive incomplete trigger revision cycles. Submitting complete, pre-reviewed packages on the first attempt is the single most reliable way to reduce IRB cycle time.
- Site staffing gaps. Staff turnover at investigative sites is the leading cause of activation slippage in 2026. Sponsors that conduct staffing assessments before site selection, not after, avoid the worst delays.
- Documentation bottlenecks. Protocol-adjacent source documents average 5.84 weeks to receive, with some sites taking up to 20 weeks. Manual preparation of case report forms, lab manuals, and pharmacy documents remains common. Sponsors that assign explicit ownership and service-level agreements to each document type close this gap faster.
Manufacturing disruptions add a separate layer of risk. A failed manufacturing site can force protocol amendments and IRB reapprovals that take 60–90 days. Those delays cascade sequentially through enrollment, extending the trial timeline by far more than the original disruption. Sponsors that complete contingency assessments before inventory depletion, not after a failure occurs, avoid the sequential slippage that destroys enrollment plans and compresses valuation.
Pro Tip: Run a pre-SIV readiness audit covering staffing, pharmacy setup, and IRB consent alignment at every site before the site initiation visit. Pre-SIV readiness checks catch the enrollment bottlenecks that activation checklists miss.
How do patent strategy and transaction readiness affect valuation?
A layered patent portfolio is not a legal formality. Strategically layered filings reduce investor-perceived risk and create multiple commercialization pathways, including licensing, co-development, and outright sale. A company with broad composition-of-matter patents, method-of-use filings, and formulation patents commands more negotiating leverage in M&A discussions than one with a single foundational patent.

Early IP investment pays dividends across the entire company lifecycle. Filing before Phase I preserves the broadest claims. Filing after proof-of-concept data narrows the claims but strengthens their defensibility. The most effective biotech IP strategies combine both: broad early filings followed by data-supported continuation applications that tighten protection around the validated mechanism.
Transaction readiness operates alongside IP strategy as a valuation multiplier. Lean operating models with credible data packages and disciplined capital allocation increase investor confidence and support multiple exit options. A company that can present clean financials, a clear milestone map, and a defensible regulatory strategy closes deals faster and at better terms.
"Transaction-ready biotechs allocate capital toward clinical milestones and flexible exit paths. Investors reward that discipline with higher valuations." — Danforth Health
The practical benefits of transaction readiness include:
- Faster due diligence cycles, because data rooms are organized and complete
- Higher bid confidence, because acquirers can model the asset without filling in gaps
- Multiple exit pathways, including IPO, strategic partnership, and full acquisition, preserved simultaneously
- Reduced negotiation discount, because credible data removes the uncertainty premium buyers build into offers
Which tools and metrics best support biotech valuation growth?
The right valuation model depends on the company's stage and the purpose of the analysis. The table below compares the three most commonly used approaches.
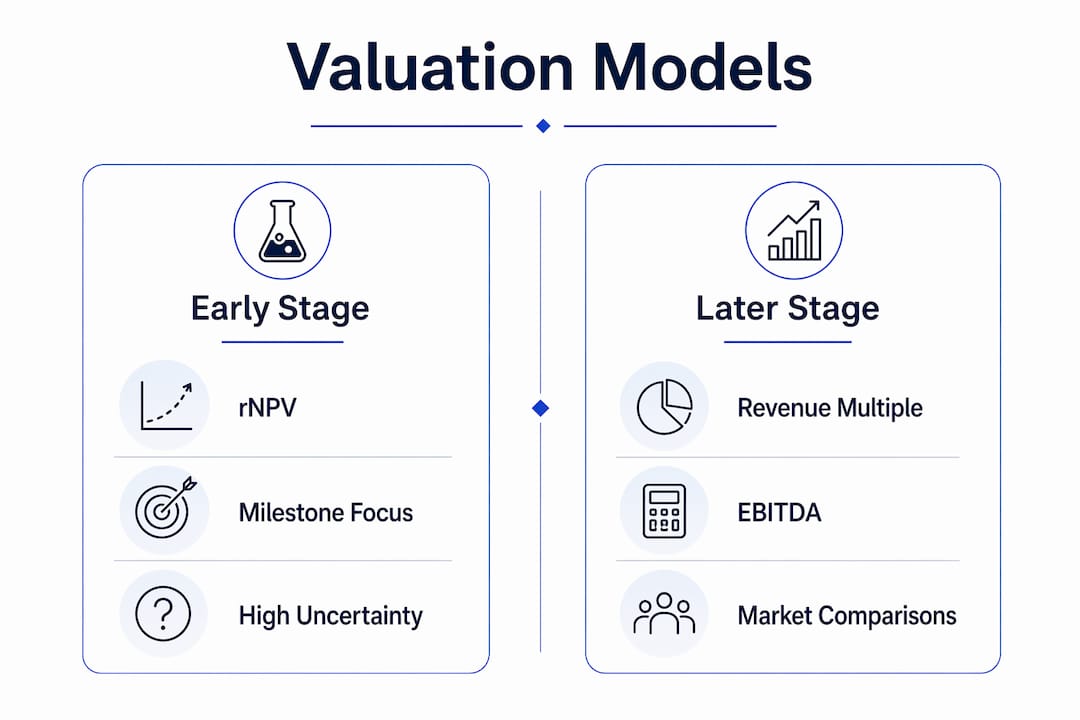
| Valuation method | Best suited for | Key limitation |
|---|---|---|
| rNPV | Pre-revenue pipeline assets | Sensitive to discount rate and probability assumptions |
| Comparable company multiples | Late-stage or near-commercial biotechs | Requires a peer group with similar assets |
| Precedent transactions | M&A and licensing deal pricing | Historical data may not reflect current market conditions |
Internal operational metrics tied directly to valuation impact include:
- Site activation time from contract execution to first patient enrolled
- Document turnaround time for protocol-adjacent source materials, with a target well below the industry average of 5.84 weeks
- Contingency lead time for manufacturing disruptions, measured from detection to sponsor response
- Milestone achievement rate, tracking the percentage of planned milestones hit on schedule
Organizational practices matter as much as tools. Cross-functional integration between clinical operations, regulatory affairs, and finance prevents the information silos that cause milestone slippage. Milestone-driven capital allocation keeps spending focused on the activities that move the rNPV needle. Proactive risk management, including site activation as a program-level risk architecture, catches problems before they cascade.
AI tools are changing the speed of regulatory and clinical work. AI in regulatory affairs accelerates document drafting, submission formatting, and gap analysis, reducing the manual labor that slows regulatory timelines. On the clinical side, AI-supported enrollment tools close the gap between protocol design and patient recruitment, a persistent source of trial delay. Teams that integrate these tools into their workflows gain measurable time advantages over those that do not.
Pro Tip: Track your site activation time as a financial metric, not just an operational one. Every week saved between contract execution and first patient enrolled has a calculable rNPV impact. Present that number to your board alongside the clinical update.
Key Takeaways
Maximizing biotech company valuation requires reducing time-to-cashflow, building layered IP protection, and maintaining transaction readiness at every clinical stage.
| Point | Details |
|---|---|
| rNPV drives pre-revenue valuation | Clinical phase and time-to-cashflow are the two most sensitive inputs in any biotech valuation model. |
| Site activation is a financial lever | Compressing activation from 9–15 months to 4–6 months directly increases rNPV by shortening the discount window. |
| Document delays are measurable and fixable | Source document receipt averages 5.84 weeks; assigning ownership and SLAs closes this gap faster than any other single tactic. |
| Layered patents multiply exit options | Broad early filings combined with data-supported continuations protect more commercial pathways and reduce acquirer risk perception. |
| Transaction readiness accelerates deal terms | Clean data rooms, credible milestone maps, and lean operations reduce the uncertainty discount buyers apply to offers. |
The operational lever most executives underestimate
Site activation is treated as a project management problem at most biotech companies. That framing is wrong, and it costs real money. Site activation is a financial risk event. Every week of delay between contract execution and first patient enrolled pushes your rNPV down in a way that is entirely calculable. I have seen companies spend months debating discount rate assumptions in their valuation models while ignoring a 12-week IRB queue that was doing far more damage.
The 2026 biotech environment makes this worse. Regulatory and strategy changes are compressing operational windows. Sites are managing more studies with the same staff. Contract backlogs are longer. The sponsors that are winning are the ones treating activation as a program-level risk architecture, not a site-by-site checklist exercise.
The same logic applies to manufacturing contingency planning. Most sponsors do not assess their contingency options until after a disruption occurs. By then, the 60–90 day amendment and reapproval cycle has already started. The cost of a proactive assessment is trivial compared to the rNPV impact of a three-month enrollment pause.
IP strategy is the one area where I see the opposite mistake. Executives invest heavily in early filings and then stop. The real value comes from continuation applications filed after proof-of-concept data, because those filings are defensible in a way that early broad claims are not. A disciplined capital allocation approach treats IP maintenance as a milestone-linked activity, not an annual legal budget line.
The biotechs that will command the highest valuations in 2026 are not necessarily the ones with the best science. They are the ones that can demonstrate operational credibility alongside clinical promise.
— John
How Haiphai helps biotech teams reclaim lost time
Operational delays are not inevitable. Haiphai works as an operational partner for life sciences teams, starting from your strategic goals and working backward to identify the specific bottlenecks slowing your path to approval.
Haiphai integrates AI into regulatory drafting, clinical site activation workflows, and document management, the exact processes where delays compound fastest. Clients report reclaiming up to 18 months of operational time on their path to approval. That time has a direct rNPV value. Explore Haiphai's solutions to see which workflows apply to your current stage, or review the full service offerings for expert-led operational strategy support tailored to your commercialization timeline.
FAQ
What is rNPV and why does it matter for biotech valuation?
Risk-adjusted net present value (rNPV) is the standard method for valuing pre-revenue biotech assets. It discounts future cash flows to present value and adjusts for the probability of clearing each clinical and regulatory hurdle.
What is a biotech valuation milestone?
A valuation milestone is a clinical or regulatory event, such as Phase II readout or FDA approval, that triggers a step-change increase in rNPV by raising the probability of commercial success.
How does the competitive landscape affect biotech valuation?
A crowded therapeutic area reduces peak revenue forecasts and increases the risk that a competitor reaches market first, both of which compress rNPV and reduce investor willingness to pay a premium.
How can a small biotech boost its startup value without large capital reserves?
Lean operations focused on milestone-driven execution, early IP filings, and clean data packages allow smaller teams to maintain transaction readiness and command competitive valuations without heavy fixed overhead.
How long does site activation typically take, and why does it matter?
Median Phase II site activation runs 9–15 months post-pandemic. Structural investments can reduce this to 4–6 months, directly improving valuation by shortening the time before cashflow-generating trial data becomes available.