
TL;DR:
- A biotech value inflection point is a milestone that causes a step-change in company valuation by resolving a specific risk. Reaching the next inflection faster preserves equity, strengthens fundraising, and can be accelerated with AI-powered operational support.
A biotech value inflection point is a discrete milestone event that causes a step-change in company valuation by resolving a specific category of risk, triggering investors to reprice the asset upward in their rNPV models. Phase II proof-of-concept is the single most consequential example: a positive readout can push cumulative probability-of-success significantly higher from early low levels, producing the largest single rNPV uplift in most programs.
Three things you can do right now:
- Confirm decision-gate criteria. Define explicit go/stop thresholds for your next milestone before you spend another dollar on execution.
- Secure milestone-sufficient funding. Work backward from the target readout to calculate the minimum capital required to reach it, not just the next calendar quarter.
- Map critical-path dependencies. Identify which operational bottleneck, whether site activation, regulatory drafting, or CMC, sits on the critical path to that milestone.
Reaching the next inflection faster preserves equity, strengthens your fundraising position, and is exactly where Haiphai's embedded AI operational partnership creates measurable impact.
Table of Contents
- Why inflection points drive investor behavior and valuation
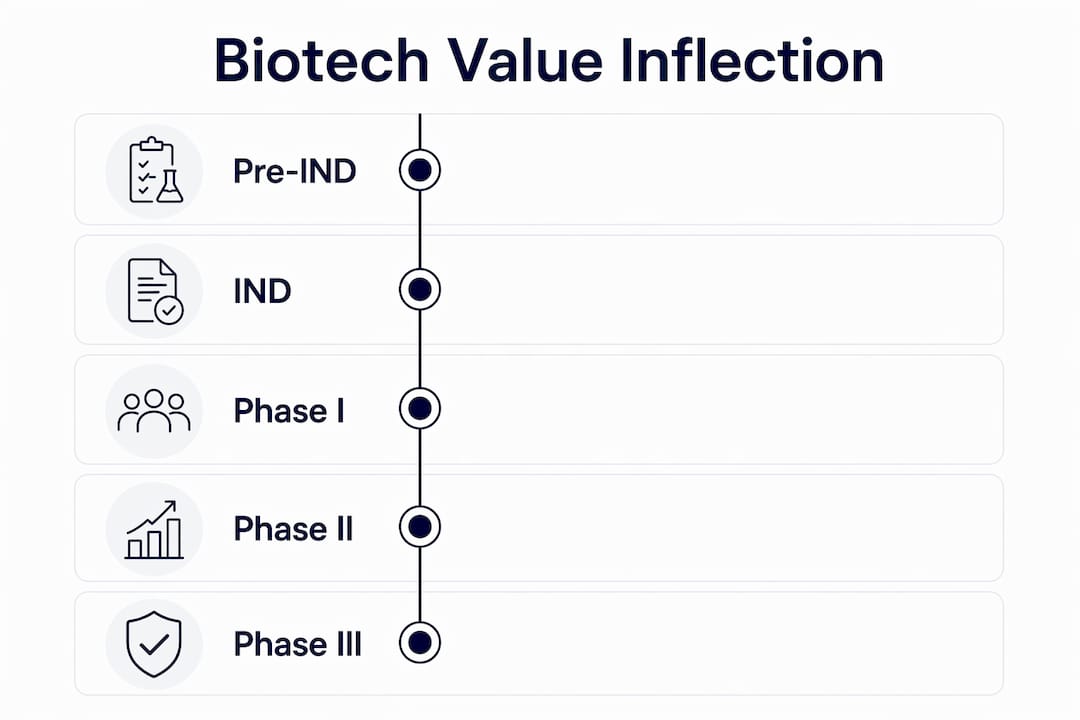
- Common biotech value inflection points and their valuation impact
- How investors model inflection points using rNPV
- Operational levers that shorten time-to-inflection
- A 30/90/180-day readiness checklist
- Leading indicators investors want to see
- Pitfalls that destroy value before an inflection point
- How AI-enabled operational partnership accelerates value capture
- Integrating commercial considerations early to maximize value
- Key Takeaways
- The trade-offs biotech leaders actually face
- Haiphai shortens the path to your next inflection point
- Useful sources
- FAQ
Why inflection points drive investor behavior and valuation
Investors do not reprice biotech companies gradually. They wait for discrete events that resolve a defined category of risk, then adjust their models in a single step. That asymmetry is what makes timing so consequential.

rNPV is the standard framework: it applies a probability-of-success weight to projected cash flows at each clinical and regulatory stage, then discounts at a financial rate (practitioners commonly observe 8–10%). When a milestone passes, the probability weight jumps, and the present value of the entire future cash flow stream re-rates upward. A company that reaches Phase II six months earlier than a competitor captures that re-rating six months sooner, with less dilution along the way.
The fundraising implication is direct. Tranche-based raises tied to milestone achievement let you negotiate from a stronger position at each round, because the risk the next investor is pricing has already been partially resolved. Raising on a calendar schedule instead means selling equity before the value-creating event, which is the most common and most avoidable source of dilution in early-stage biotech.
The overlooked challenge in most funding rounds is not the science — it is alignment on rNPV assumptions. When founders and investors use different probability-of-success estimates or discount rates, the valuation gap can be large enough to kill a deal that both sides actually want to close. Resolving that gap requires a shared model, not a better pitch deck.
Common biotech value inflection points and their valuation impact
Each milestone resolves a different type of uncertainty. The value impact scales with how much risk is removed.
- IND filing. Confirms preclinical safety and regulatory readiness. Relatively modest valuation impact, but gates everything downstream.
- Phase I initiation. Signals first-in-human dosing. Resolves some safety uncertainty; probability-of-success increases modestly.
- Phase II proof-of-concept readout. The largest single inflection for most programs. Provides the first meaningful efficacy signal in patients and drives the biggest rNPV step-change.
- Breakthrough Therapy designation (BTD). An immediate market re-rating event. BTD signals FDA recognition of substantial improvement over existing therapy and can compress development timelines materially.
- Phase III initiation. Confirms the pivotal design is locked and funded. Incremental uplift, since Phase II already de-risked the core efficacy question.
- Phase III readout. Binary and high-stakes. Upside is often smaller than Phase II if the asset was well de-risked; downside is total.
- NDA/BLA acceptance and PDUFA date assignment. Confirms regulatory package quality. Moderate uplift; shifts investor focus to commercial readiness.
- Approval. Resolves regulatory risk entirely. Value now shifts to commercial execution assumptions.
- Major partnership or licensing deal. Validates asset value through an arm's-length transaction; often triggers a re-rating comparable to a late-stage clinical event.
Phase III upside tends to be smaller than Phase II precisely because a successful Phase II already absorbed most of the efficacy uncertainty. That is why operational resources are best concentrated on reaching a clean Phase II readout as fast as possible.
How investors model inflection points using rNPV
rNPV converts milestone de-risking into present value by separating clinical risk from financial discounting. The probability weight at each phase multiplies the projected post-commercialization cash flows; the financial discount rate then brings that probability-weighted figure to today's dollars.
| Phase | Illustrative PoS range | Illustrative value uplift on positive outcome |
|---|---|---|
| Pre-IND to IND | — | Low; gates access to clinical risk |
| Phase I to Phase II | Low teens | Moderate; safety de-risking |
| Phase II readout | 50–65% | High; first efficacy signal, largest step-change |
| Phase III readout | — | Moderate to high; binary outcome |
| Approval | — | Moderate; commercial assumptions now dominate |
PoS ranges for Phase II are based on cumulative probability-of-success typically rising from the low teens to 50–65% on positive Phase II data, as observed in industry practice. Other phases are presented qualitatively, since actual figures vary by therapeutic area, indication, and program-specific data.
Valuation gaps between founders and investors typically come from four sources: different PoS assumptions by therapeutic area, discount rate selection, peak sales estimates, and commercial uptake timelines. Different valuation methods (rNPV, VC formula, real options) can produce materially different conclusions even when both parties agree on the science.
Pro Tip: When entering a funding conversation, share your rNPV model inputs explicitly: PoS by phase, discount rate, peak sales assumption, and launch year. Investors who disagree will tell you exactly where, which turns a negotiation into a solvable modeling problem.
Operational levers that shorten time-to-inflection
Execution speed is where value is made or lost between milestones. These levers have the highest ROI:
- Protocol design and adaptive trials. A well-designed adaptive protocol can reduce sample size requirements and shorten the path to a clean readout. AI tools can model adaptive designs and simulate interim analyses before a single patient is enrolled.
- Site activation and recruitment. Slow site activation is the most common cause of timeline slippage. AI-assisted site selection uses historical enrollment data to predict which sites will actually perform, cutting activation time and improving screen-to-randomize ratios.
- Regulatory drafting and submission readiness. Iterative review cycles on IND amendments, briefing documents, and module drafts consume months. AI-enabled regulatory drafting reduces review iterations and compresses the time from data lock to submission-ready package.
- CMC de-risking. Manufacturing holds are a leading cause of NDA delays. Early CMC investment, particularly in analytical method development, removes a risk that investors discount heavily.
- Data quality and endpoint readiness. Clean data at interim analysis prevents protocol amendments that reset timelines. AI-driven data monitoring flags anomalies in near real time.
- Payer evidence integration. Health economics and outcomes research started at Phase II, not Phase III, strengthens reimbursement positioning and raises the commercial assumptions in investor models.
Pro Tip: Sequence AI pilots by critical-path impact, not by ease of implementation. Regulatory drafting automation and site selection typically sit on the critical path; starting there produces the fastest timeline benefit and the clearest investor signal.
A 30/90/180-day readiness checklist
| Timeline | Priority actions | Owner | Expected impact |
|---|---|---|---|
| 30 days | Diagnostic mapping of operational bottlenecks; confirm go/stop criteria for next milestone; assign owners to each critical-path workstream | CMO + Head of Ops | Baseline clarity; eliminates ambiguity on decision gates |
| 90 days | Launch regulatory drafting automation pilot; accelerate site activation process; tighten endpoint definitions; update rNPV inputs with current PoS data | Head of Regulatory + Head of Data | Measurable reduction in review cycles; improved KPI baseline |
| 180 days | Lock pivotal design; secure milestone-sufficient financing in tranches; finalize partnering materials and term sheet assumptions | CMO + CFO + Head of Ops | Investor-ready data package; reduced dilution at next raise |
Leading indicators investors want to see
Investors increasingly look for operational KPIs as evidence of execution quality, not just milestone dates. Leading indicators give earlier, cleaner signals than calendar progress alone.
| KPI | Investor signal | Target band |
|---|---|---|
| Site activation time | Speed of execution infrastructure | Under 90 days from contract to first patient |
| Screen-to-randomize ratio | Protocol quality and site fit | Above 30% (indication-dependent) |
| Data lock velocity | Data operations maturity | Within 30 days of last patient visit |
| Protocol amendment rate | Trial design stability | Zero major amendments post-Phase II start |
| Regulatory deliverable readiness | Submission confidence | Most planned deliverables on schedule at 90-day checkpoint |
These operational KPIs matter because they predict milestone timing with more precision than a Gantt chart. A site activation time under 90 days tells an investor the team can execute; a 180-day activation time tells them the timeline is already slipping.
Pitfalls that destroy value before an inflection point
- Raising on calendar, not milestone. Selling equity before a de-risking event means pricing it at the pre-event valuation. Work backward from the milestone to define minimum sufficient capital.
- Weak trial design. An underpowered or poorly controlled study produces ambiguous data that neither confirms nor refutes efficacy, which is worse than a clean negative. Investors cannot re-rate on ambiguity.
- Poor data quality. Unresolved queries at interim analysis force protocol amendments that reset the timeline clock.
- Underestimating CMC timelines. Manufacturing scale-up consistently takes longer than projected. A CMC hold six months before NDA submission is one of the most value-destructive events in late-stage development.
- Misaligned rNPV assumptions. When founders and investors use different PoS or peak sales figures without resolving the gap, term sheets stall. Share your model inputs early.
- Zombie programs. Programs without explicit go/stop criteria consume resources without increasing enterprise value. Every program needs a decision gate with a date and a threshold.
A program that reaches Phase II without a pre-specified success criterion is not a clinical trial. It is an expensive opinion poll.
How AI-enabled operational partnership accelerates value capture
A mid-size oncology biotech faced a 14-month gap between IND clearance and projected Phase II initiation, driven by slow site activation and iterative regulatory drafting cycles. By embedding an AI operational partnership, the team automated first-draft generation for FDA briefing documents and used predictive site-selection modeling to prioritize the 12 highest-performing sites from an initial list of 40.
The result: site activation time dropped from an average of 160 days to under 85 days, and regulatory drafting cycles were cut from four review rounds to two. The program reached Phase II initiation ahead of the original timeline, with a cleaner data package and a stronger Series B narrative. Haiphai's operational diagnostic approach identified both bottlenecks within the first 30 days of engagement.
Three replicable lessons:
- Start the operational diagnostic before the next milestone is imminent, not after a delay has already occurred.
- Treat regulatory drafting automation as a critical-path intervention, not a back-office efficiency.
- Use site-selection data to set realistic activation timelines in investor models, which closes a common source of rNPV disagreement.
Integrating commercial considerations early to maximize value
Commercial planning that begins at Phase II, not Phase III, consistently produces higher rNPV inputs and stronger partnering positions. A full value lens integrates patient needs, payer expectations, and market access strategy into development decisions from the start.
The practical implication: payer evidence milestones (health economics modeling, real-world data strategy, formulary positioning analysis) should appear on the same critical-path tracker as clinical and regulatory milestones. An asset that reaches approval without a reimbursement strategy is not commercially ready, and investors price that gap.
Competitive landscape monitoring also belongs in this early phase. A competitor's Phase III readout or a new entrant in your indication can shift the peak sales assumptions in every investor's model overnight. Teams that track competitive dynamics continuously can adjust their positioning and partnering strategy before the market moves, not after.
Key Takeaways
A biotech value inflection point is a milestone that triggers a discrete rNPV re-rating, and reaching the next one faster, with cleaner data, is the single highest-leverage action available to biotech leadership.
| Point | Details |
|---|---|
| Phase II is the biggest inflection | Positive Phase II data can push cumulative probability-of-success substantially higher from early low levels, creating the largest single rNPV step-change. |
| Raise on milestones, not calendars | Working backward from a target readout to define minimum sufficient capital reduces unnecessary dilution at each round. |
| Operational KPIs signal execution quality | Site activation under 90 days, data lock within 30 days of last patient visit, and zero major protocol amendments are the metrics investors track. |
| Zombie programs destroy value | Every program needs explicit go/stop criteria with a date and a threshold; programs without them consume resources without increasing enterprise value. |
| Haiphai accelerates the critical path | Haiphai's embedded AI operational partnership identifies bottlenecks within 30 days and has helped clients reclaim up to 18 months on the path to approval. |
The trade-offs biotech leaders actually face
The conventional wisdom says "move fast." The more useful advice is: move fast on the right things, and be honest about which bottlenecks are actually on your critical path versus which ones just feel urgent.
Most biotech teams I work with have two or three genuine critical-path constraints and a long list of things that feel like constraints. The diagnostic work matters because it separates them. Regulatory drafting automation, for example, is almost always on the critical path for an IND-stage company. Site activation is almost always on the critical path for a Phase II company. CMC is almost always underestimated by everyone, at every stage.
The speed-versus-evidence-depth trade-off is real, but it is usually framed wrong. The question is not "how fast can we move?" It is "what is the minimum evidence package that resolves the specific uncertainty investors are pricing?" A clean, well-powered Phase II in a focused patient population beats a larger, messier study every time, both scientifically and in terms of rNPV impact.
Governance matters as much as the AI tools themselves. Pilots that run without defined success criteria and ownership produce noise, not evidence. The teams that capture the most value from AI-enabled operations are the ones that treat each pilot as a decision gate, with a clear KPI, a timeline, and a named owner.
Haiphai's model, project-based diagnostics followed by a retainer operational partnership, is designed for exactly this: identify the real bottlenecks first, then build the AI-enabled workflows that address them, with governance baked in from day one.
Haiphai shortens the path to your next inflection point
Reclaiming up to 18 months on the path to approval is not a marketing claim. It is what happens when you remove the two or three operational bottlenecks that actually sit on your critical path, rather than optimizing everything at once.
Haiphai's embedded AI operational partnership starts with a 30-day diagnostic that maps your specific bottlenecks against your next milestone. From there, the team designs and deploys tailored AI-enabled workflows, covering regulatory drafting automation, site activation optimization, and governed data operations, built around your program, not a generic template. Three outcomes investors notice directly:
- Faster site activation produces earlier enrollment data, which tightens your Phase II timeline and strengthens your Series B narrative.
- Fewer regulatory drafting cycles mean a cleaner, faster submission-ready package and fewer surprises at FDA.
- Integrated payer evidence from Phase II raises the commercial assumptions in your rNPV model before you need to defend them in a term sheet.
Ready to identify where your critical path is actually losing time? Explore Haiphai's solutions or visit the services page to start a conversation about your next milestone.
Useful sources
- WIPO Valuation in Biotechnology and Pharmaceuticals — A thorough primer on rNPV, DCF, and real options as applied to biotech IP; useful for building or stress-testing your valuation model before investor conversations.
- Analysis Group: Biotech Asset Valuation Methods — Practitioner-level comparison of rNPV, VC formula, and real options; explains why valuation gaps arise and how to close them.
- Evaluate: How to Value a Biotech Company — Accessible overview of valuation inputs (pipeline data, market forecasts, competitive intelligence) with a practical table of what each input does in an rNPV model.
- Lumanity: Biotech Value Creation at an Inflection Point — Strategy-level guidance on integrating commercial considerations and a full value lens into development planning from Phase II onward.
- Healthcare IB Guide: Biotech Lifecycle and Value Inflection Points — Clear milestone-by-milestone breakdown of how each clinical event affects probability-of-success and rNPV; good reference for building investor-facing milestone tables.
- Haiphai Blog — Operational and AI augmentation guidance written specifically for biotech leaders, covering regulatory drafting, enrollment, and operating model design.
FAQ
What is a value inflection point in biotech?
A biotech value inflection point is a discrete milestone event that resolves a specific category of clinical or regulatory risk, causing investors to reprice the asset upward in their rNPV models. Phase II proof-of-concept is the most common example.
Why does Phase II matter more than Phase III for valuation?
Phase II provides the first meaningful efficacy signal in patients, pushing cumulative probability-of-success from the low teens to 50–65% and producing the largest single rNPV uplift. Phase III upside is typically smaller because Phase II already absorbed most of the efficacy uncertainty.
How does rNPV capture milestone-driven value changes?
rNPV applies a probability-of-success weight to projected cash flows at each clinical stage and discounts at a financial rate. When a milestone passes and the probability weight increases, the present value of the entire future cash flow stream re-rates upward in a single step.
What operational KPIs do investors track between milestones?
Investors focus on site activation time, screen-to-randomize ratio, data lock velocity, and protocol amendment rate. These leading indicators predict milestone timing more reliably than calendar progress and signal execution quality before a readout occurs.
How can Haiphai help accelerate a biotech's next inflection point?
Haiphai runs a 30-day operational diagnostic to identify the bottlenecks on your critical path, then deploys tailored AI-enabled workflows covering regulatory drafting, site activation, and data operations. Clients have reclaimed up to 18 months on the path to approval.