
Biotech investment performance metrics fall into three distinct categories: fund-level returns, asset valuation models, and operational execution indicators. Each category answers a different question. Fund metrics like IRR, TVPI, and DPI tell you how a portfolio is performing relative to capital deployed. Risk-adjusted net present value (rNPV) tells you what a single drug asset is worth given clinical uncertainty. Operational KPIs like cash runway and time-to-FDA-approval tell you whether a company can survive long enough to realize that value. Structuring these into a coherent framework is the foundation of rigorous biotech investment analysis.
What are the essential fund-level performance metrics in biotech?
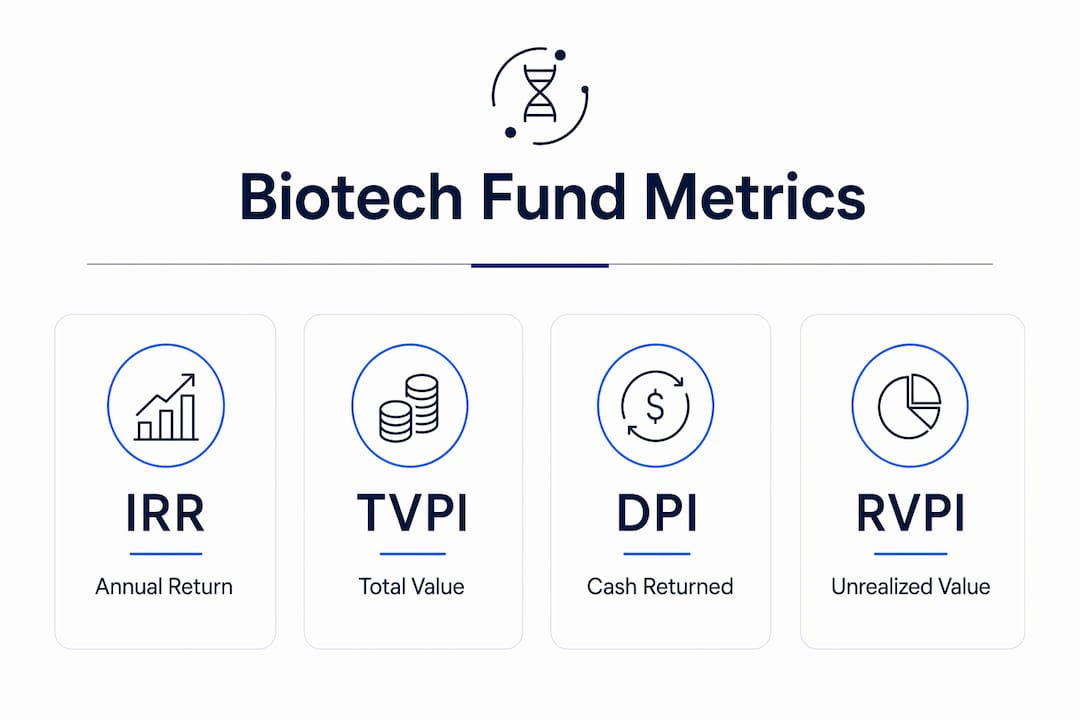
Venture capital fund performance in biotech is measured by four core metrics: IRR, TVPI, DPI, and RVPI. Top-quartile funds show 25%+ IRR, 3.0x+ TVPI, and 1.0x+ DPI by year 10, according to benchmarks from Burgiss and Preqin. Those numbers set the bar for what institutional LPs expect from a high-performing biotech fund.
IRR, TVPI, DPI, and RVPI defined
IRR (Internal Rate of Return) is the annualized return on invested capital, accounting for the timing of cash flows. It rewards early exits and penalizes slow distributions, which matters in biotech where development timelines stretch 10–15 years.

TVPI (Total Value to Paid-In) is the ratio of total fund value (realized plus unrealized) to capital invested. A 3.0x TVPI means every dollar invested is now worth three. The problem: unrealized value is marked by the GP, not the market.
DPI (Distributions to Paid-In) measures only cash returned to LPs. DPI is the most credible metric because it cannot be inflated by optimistic portfolio markups. Top-quartile DPI reaches 1.5x or higher by year 10; median funds often sit below 0.8x despite higher TVPI.
RVPI (Residual Value to Paid-In) captures the unrealized portion. Early in a fund's life, RVPI dominates TVPI. As the fund matures and exits occur, DPI rises and RVPI falls. A fund near the end of its life with high RVPI and low DPI is a warning sign.
The J-curve and fund maturity
The J-curve effect is real in biotech. Early years show management fees and initial investments with no exits, so IRR and DPI are negative or near zero. Fund-level metrics require maturity context: a year-three fund with zero DPI is normal; a year-ten fund with zero DPI is not. Top-quartile VC funds also outperform public markets with PME ratios between 1.3 and 1.6x, meaning 30–60% more return than comparable public equities net of fees.
| Metric | Formula | Benchmark (top quartile) | What it measures |
|---|---|---|---|
| IRR | Annualized return on cash flows | 25%+ | Time-weighted return |
| TVPI | (Realized + Unrealized) / Paid-In | 3.0x+ | Total fund value multiple |
| DPI | Distributions / Paid-In | 1.5x+ by year 10 | Actual cash returned |
| RVPI | Unrealized Value / Paid-In | Declines with maturity | Paper value remaining |
Pro Tip: If a fund is past year eight and TVPI is 2.5x but DPI is below 0.5x, the bulk of that value is still on paper. Ask the GP for a distribution timeline before treating that TVPI as real performance.
How to apply rNPV to value biotech projects
Traditional valuation tools fail in biotech. Revenue multiples and EBITDA analysis require revenue. Most early-stage biotechs have none. Risk-adjusted NPV is the industry standard for valuing drug assets because it adjusts expected cash flows by the probability that the asset will actually reach the market.
How rNPV works
rNPV multiplies each future cash flow by the cumulative probability of clinical success at that stage, then discounts those probability-weighted flows back to present value. The result is a valuation that reflects both the upside of approval and the realistic likelihood of getting there.
The key inputs are phase transition probabilities, development costs, timing assumptions, and peak sales forecasts. Cumulative probability of success varies sharply by phase: Phase 1 assets carry roughly 8–12% cumulative PoS through approval, while Phase 3 assets reach approximately 50–55%. That difference alone can shift a valuation by an order of magnitude.
| Clinical Phase | Cumulative PoS (approx.) | rNPV Implication |
|---|---|---|
| Preclinical | 3–5% | Very high risk discount |
| Phase 1 | 8–12% | Speculative; timing-sensitive |
| Phase 2 | 20–30% | Moderate; scenario analysis critical |
| Phase 3 | 50–55% | Significant value inflection |
| NDA/BLA Filed | 85–90% | Near-commercial valuation |
Scenario analysis and portfolio ranking
rNPV is most useful when run across multiple scenarios: base case, optimistic, and pessimistic. Each scenario adjusts PoS and timing assumptions to show the range of possible outcomes. For portfolio ranking, Ambrosia Ventures and similar biotech-focused advisors use rNPV to compare assets across therapeutic areas on a risk-adjusted basis.
Pro Tip: In rNPV modeling, probability and timing assumptions drive outcomes more than the discount rate. A six-month delay in Phase 3 completion can reduce rNPV by 10–15%. Model those variables first, not last.
Which operating metrics track biotech execution risk?
Fund metrics tell you how a portfolio is performing. rNPV tells you what an asset is worth. Operating metrics tell you whether the company running that asset will survive to realize the value. These are the metrics that separate ongoing investment monitoring from one-time due diligence.
Key operating metrics for biotech therapeutics companies include:
- Cash runway: Months of operation funded at the current burn rate. Calculated as cash on hand divided by monthly operating cash outflow. A runway below 12 months triggers dilutive financing risk.
- Net operating cash flow: The actual cash consumed by operations each quarter. Monitoring six-month operating cash outflow and net loss reveals whether burn is accelerating or stabilizing.
- Time-to-FDA-approval: A project execution metric that tracks progress against development milestones. Delays here compress the commercial window and reduce rNPV directly.
- Milestone payments received: Cash received from partners upon hitting development or regulatory milestones. These payments validate execution and reduce reliance on equity raises.
- Net loss per period: A standard financial health indicator. Net loss and cash burn over defined periods are critical in assessing a biotech company's financial viability.
The distinction between these metrics and fund-level measures matters. IRR and TVPI reflect what has already happened at the portfolio level. Operating metrics are forward-looking signals. A company with strong rNPV but deteriorating cash runway is a company that may not reach the value inflection point. Haiphai's work with life sciences teams shows that operational delays, particularly in regulatory drafting and clinical site activation, are among the most common drivers of runway compression. Understanding how a lean biotech team executes at scale is directly relevant to interpreting these metrics.
How to integrate these metrics into a single analysis framework
The goal is not to track every metric. The goal is to use the right metric at the right stage of analysis. A coherent framework assigns metrics to three layers: fund performance, asset valuation, and company execution.
Step-by-step integration approach
Step 1: Establish fund maturity context. Before interpreting any metric, determine where the fund sits in its lifecycle. Early funds should be evaluated on TVPI and IRR trajectory. Late funds must show DPI. LPs treat DPI as the truth serum of fund evaluation because it reflects actual liquidity, not GP-marked valuations.
Step 2: Run rNPV for each asset. Build a base-case rNPV for every portfolio company with a clinical-stage asset. Use phase-appropriate PoS rates and realistic timing. This gives you a risk-adjusted view of each company's intrinsic value.
Step 3: Apply the Profitability Index for capital allocation. When capital is constrained, ranking assets by absolute rNPV misleads. The Profitability Index (PI = rNPV divided by incremental capital required) identifies which assets generate the most value per dollar deployed. Capital-efficient assets rank higher under PI even if their absolute rNPV is lower. Governance committees in multi-asset biopharma portfolios consistently favor PI for milestone funding decisions over headline rNPV rankings.
Step 4: Monitor operating metrics quarterly. Set thresholds for cash runway (minimum 18 months), net loss trends, and milestone delivery. Flag any company where runway drops below 12 months or where time-to-FDA-approval slips more than one quarter.
| Analysis stage | Primary metrics | Secondary metrics |
|---|---|---|
| Fund performance | IRR, TVPI, DPI, RVPI | PME ratio |
| Asset valuation | rNPV, PoS by phase | Scenario NPV range |
| Capital allocation | Profitability Index | Capital efficiency ratio |
| Ongoing monitoring | Cash runway, net loss | Milestone payments, burn rate |
Common mistakes and how to avoid them
The most common error is treating TVPI as a proxy for fund success in a late-stage fund. The second is ranking portfolio assets by headline rNPV without adjusting for capital requirements. The third is ignoring operating metrics until a company is already in distress. Integrating AI regulatory tools into monitoring workflows can surface execution delays before they show up in quarterly financials.
Pro Tip: Never rank biotech assets by rNPV alone when capital is limited. A $200M rNPV asset requiring $150M in additional investment may be less attractive than a $120M rNPV asset requiring $40M. The Profitability Index surfaces that difference immediately.
Key takeaways
Effective biotech investment analysis requires three distinct metric categories working together: fund-level returns, risk-adjusted asset valuations, and operational execution indicators.
| Point | Details |
|---|---|
| DPI is the credibility standard | Use DPI as the primary fund metric for late-stage funds; TVPI alone is unreliable. |
| rNPV requires phase-specific PoS | Apply cumulative probability of success by clinical phase to avoid overstating asset value. |
| Profitability Index beats headline rNPV | Rank assets by rNPV divided by capital required when allocating under budget constraints. |
| Cash runway is a forward-looking signal | Monitor runway quarterly; below 12 months signals dilutive financing risk before it hits the cap table. |
| Metrics must match fund maturity | Early funds are judged on trajectory; late funds are judged on DPI and actual distributions. |
Where conventional wisdom on biotech metrics falls short
Most frameworks I see in practice treat these three metric categories as separate reports rather than an integrated system. A fund manager reviews IRR in one meeting, rNPV in another, and cash runway in a board deck that nobody reads carefully. That fragmentation is where value gets lost.
The metric I see underused most consistently is the Profitability Index. Analysts spend hours debating whether a Phase 2 asset has a $180M or $220M rNPV, when the real question is how much additional capital that range requires. A $40M difference in rNPV means nothing if the capital requirement difference is $80M.
The metric I see misused most often is TVPI in late-stage funds. I have watched LPs celebrate a 2.8x TVPI in a year-nine fund without asking why DPI was still at 0.6x. That gap represents unrealized value that may never convert to cash, particularly in a tighter exit environment.
The trend I find genuinely useful is the integration of operational KPIs into investment monitoring at the asset level. Tracking time-to-FDA-approval and cash runway alongside rNPV gives you a real-time view of whether the valuation model is holding. When a company's runway drops below 18 months and a Phase 3 readout is still 14 months away, the rNPV needs to be stress-tested immediately, not at the next quarterly review.
Biotech investing rewards analysts who treat metrics as a system, not a checklist.
— John
How Haiphai helps you track what actually matters
Evaluating biotech investments accurately depends on having clean, timely operational data alongside your financial models. Haiphai works as an operational partner for life sciences teams, identifying the bottlenecks that inflate burn rates and compress cash runway before they show up in your quarterly metrics.
Haiphai's AI-driven approach integrates directly with the processes that drive your key operating KPIs, from regulatory drafting timelines to clinical site activation. Clients reclaim up to 18 months of operational time on the path to approval, which translates directly into stronger rNPV outcomes and better fund-level returns. If you are building or refining your investment performance framework, explore Haiphai's solutions to see how operational intelligence connects to investment metrics.
FAQ
What are the three categories of biotech investment metrics?
Biotech investment metrics fall into fund-level performance metrics (IRR, TVPI, DPI), asset valuation metrics (rNPV, PoS by phase), and operational execution metrics (cash runway, net loss, milestone payments). Each category serves a different analytical purpose.
Why is DPI considered more reliable than TVPI?
DPI measures actual cash returned to LPs and cannot be inflated by GP markups, making it the most credible fund performance metric. TVPI includes unrealized value that may never convert to distributions.
What is rNPV and why does biotech use it?
Risk-adjusted NPV (rNPV) weights future cash flows by the probability of clinical success at each development phase. Biotech uses it because most assets are pre-revenue and traditional valuation multiples cannot account for clinical attrition risk.
How do I use the Profitability Index in a biotech portfolio?
Calculate PI by dividing each asset's rNPV by the incremental capital required to reach the next value inflection point. Ranking by PI rather than absolute rNPV identifies the most capital-efficient investments when your deployment budget is limited.
What cash runway threshold should biotech investors monitor?
A cash runway below 12 months signals immediate dilutive financing risk. Most experienced investors set an internal alert at 18 months to allow time for a structured raise rather than a distressed one.