
TL;DR:
- Operational risk in biotech portfolios relates to specific uncertainties that impact time-to-market and valuation.
- Identifying and prioritizing gating uncertainties through a focused diagnostic enhances portfolio management effectiveness.
The fastest way to identify operational risk across a biotech portfolio is to build an uncertainty map tied to your rNPV thresholds, then run a short diagnostic across CMC, clinical operations, regulatory, and supply chain. Three actions to start now:
- Convene a cross-functional risk kickoff with clinical, regulatory, manufacturing, and finance leads — 90 minutes, focused on gating uncertainties only.
- Pull the minimum data set: CTMS enrollment rates, ERP/manufacturing out-of-specification (OOS) rates, vendor single-source flags, and your regulatory submission calendar.
- Run a rapid uncertainty-ranking exercise against your exit or deal thresholds, using FDA and ICH Q9(R1) risk categories as the organizing framework.
For teams that need scaled execution, Haiphai operates as an embedded operational partner, running the diagnostic and remediation work from your strategic goals backward to the bottlenecks.
Table of Contents
- What does operational risk actually mean for a U.S. biotech portfolio?
- How do you identify and prioritize operational risks across a portfolio?
- What data and analytics surface operational risk most reliably?
- How do you choose the right mitigation for each operational risk?
- What governance and reporting do boards actually need?
- How Haiphai identifies and reduces portfolio risk in practice
- What does a 3/6/12-month implementation plan look like?
- Key Takeaways
- Why operational risk identification is a strategic lever, not a compliance task
- When an operational partner accelerates your risk program
- FAQ
- Useful sources
What does operational risk actually mean for a U.S. biotech portfolio?
Operational risk in biotech is not a catch-all for "things that could go wrong." It refers to specific, addressable uncertainties across clinical operations, CMC/manufacturing, supply chain, and data/regulatory processes that materially affect time-to-market, risk-adjusted net present value (rNPV), and deal feasibility.
U.S. regulatory anchors drive the consequence of each domain. FDA guidance, ICH Q8/Q9/Q10, GCP, and GMP define what a process failure actually costs. A CMC deviation that triggers a Form 483 observation can delay an NDA by 12 months or more. A GCP audit finding can place a clinical hold. These are not abstract risks; they are valuation events.
The single most underestimated operational risk is a CMC process robustness failure late in development. When a sponsor cannot demonstrate reproducible manufacturing at scale, the entire asset's rNPV collapses — not because the science failed, but because the operational infrastructure did.
Aon's Global Risk Management Survey identifies supply chain failure, regulatory change, business interruption, cyberattack, and product liability as the top cascading risks for life sciences organizations. They amplify each other: a sole-source API supplier failure during a clinical hold is not two separate risks — it is one compounding crisis.
How do you identify and prioritize operational risks across a portfolio?
The five-step diagnostic runs: set exit thresholds → create asset inventory → map critical uncertainties → score likelihood and impact → rank by time-to-market effect.
Step 1: Set exit thresholds. Define the deal or financing conditions each asset must meet. This anchors every subsequent scoring decision to investor or acquirer reality.
Step 2: Create the inventory. List every asset, its development stage, and its four operational domains: clinical, CMC, regulatory, and supply chain. Use this as your risk register skeleton.
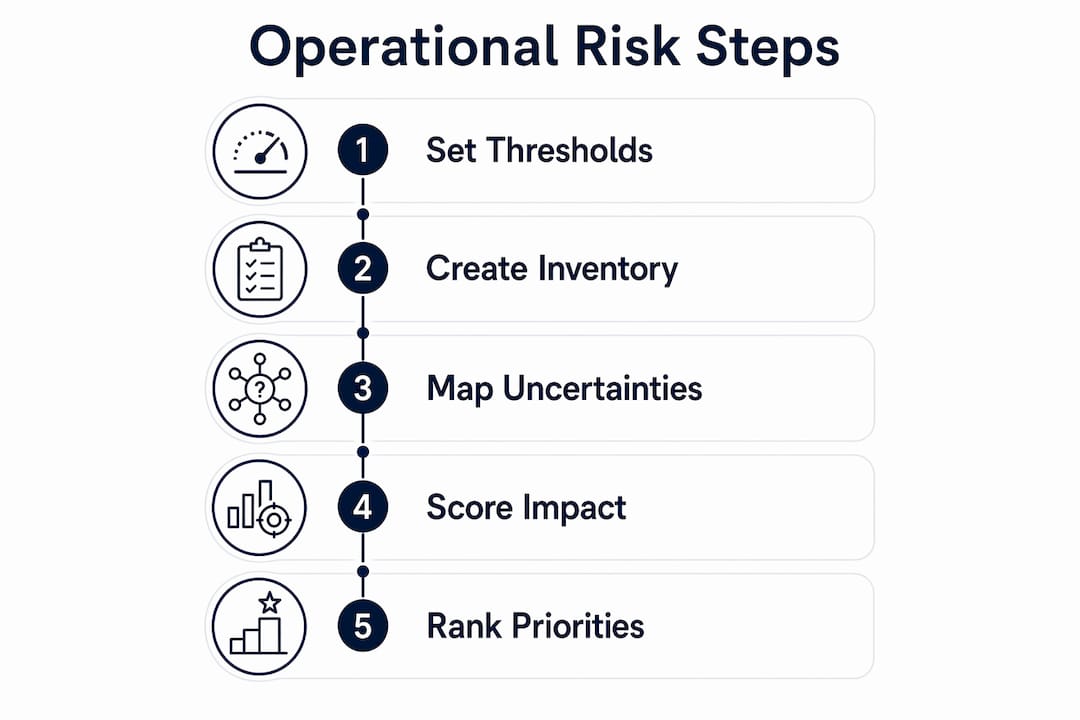
Step 3: Map critical uncertainties. For each domain, identify the single gating uncertainty — the one that, if unresolved, blocks the next value inflection point. The uncertainty map method asks which uncertainty, retired with available capital, moves cumulative deal probability the most.
Step 4: Score likelihood and impact. Use coarse probability bands (low/medium/high) and ordinal impact tied to timeline delay and rNPV effect. Precision is less important than consistency across assets.

Step 5: Rank by time-to-market impact. Sort the register by cost-of-delay per quarter, not by subjective severity. The top three items on that list are your remediation priorities.
Risk register fields: asset name, domain, gating uncertainty, probability estimate, timeline impact (weeks/months), cost-of-delay, remediation effort (person-weeks), and named owner.
| Data Source | What It Reveals | Minimum Pull |
|---|---|---|
| CTMS | Enrollment velocity, site activation lag | Monthly accrual vs. plan |
| EDC | Data completeness, query rate | % clean records per site |
| ERP/MRP | OOS/OOT rates, batch yield | Rolling 6-month trend |
| Vendor scorecards | Single-source flags, delivery SLA | Supplier concentration index |
| Regulatory calendar | Submission gaps, response deadlines | 90-day rolling window |
Pro Tip: Focus on gating uncertainties, not every conceivable risk. A register with 80 items is a compliance document. A register with 8 ranked gating uncertainties is a decision tool.
What data and analytics surface operational risk most reliably?
A small set of cross-domain metrics reveals most operational exposures before they become crises. Operational failure modes including slow patient recruitment, poor site performance, and manufacturing process weaknesses are consistently the drivers of costly portfolio delays.
The systems to query: CTMS, EDC, ERP/MRP, QMS, vendor scorecards, and your regulatory submission calendar. Most of this data already exists; the gap is usually integration, not collection.
AI and analytics add three specific capabilities: anomaly detection for site performance variance (flagging sites that will miss enrollment targets 60–90 days before they do), scenario modeling for supply chain disruptions, and probabilistic recalculation of cumulative success probability when one uncertainty is resolved. Haiphai's AI augmentation approach applies these methods to live operational data rather than static spreadsheets.
| Metric | What It Indicates | Action Threshold |
|---|---|---|
| Enrollment velocity vs. plan | Site performance, protocol feasibility | >10% below plan for 2 consecutive months |
| Protocol amendment rate | Design quality, regulatory alignment | >1 substantial amendment per phase |
| OOS/OOT rate (manufacturing) | CMC process robustness | Any upward trend over 90 days |
| Supplier concentration index | Single-source exposure | >40% of critical inputs from one supplier |
| Regulatory response lag | Submission quality, FDA relationship | >28 days past internal target |
How do you choose the right mitigation for each operational risk?
Pick the mitigation that resolves the gating uncertainty with the highest benefit per dollar and the shortest expected time-to-market impact. Spending on low-leverage manufacturing tweaks while clinical proof of concept remains unresolved is the most common sequencing error in biotech portfolios.
- Process redesign — highest leverage when the root cause is a workflow or handoff failure (e.g., site activation bottleneck, regulatory submission queue).
- Targeted automation — best for high-frequency, rule-based tasks: regulatory drafting, data reconciliation, vendor SLA tracking. AI in regulatory affairs can cut drafting cycle time significantly.
- Vendor diversification — mandatory when a single-source supplier controls a critical input. Qualification of a second source typically takes 6–18 months; start early.
- Contingency planning — for risks you cannot eliminate (clinical hold, natural disaster), pre-built response protocols cut response time from weeks to days.
- Governance and monitoring — the mitigation that prevents recurrence. Without it, resolved risks reopen.
To compute simple remediation ROI: (change in cumulative probability × expected future value) minus remediation cost. If retiring a CMC uncertainty moves deal probability from 40% to 60% on a $200M asset, the expected value gain is $40M. A $2M remediation program has a clear case.
Pro Tip: Sequence remediations to retire the highest-leverage uncertainty first. A Phase 2 asset with unresolved clinical proof of concept should not be spending on commercial manufacturing optimization.
A practical, FDA-defensible risk management program pairs ICH Q9(R1) techniques with Q10 lifecycle approaches — FMEA, CAPA, process performance monitoring, and management review — not just a risk register spreadsheet.
What governance and reporting do boards actually need?
Baseline governance requires an executive risk owner, a monthly ExCo risk pack, and a quarterly board pack covering the top five gating uncertainties with remediation status. Integrating operational, financial, and strategic data lets leadership quantify total cost of risk and frame remediation as capital allocation, not compliance overhead.
| KRI | Timeline Impact | Cost Exposure | Regulatory Flag | Remediation Status |
|---|---|---|---|---|
| Enrollment velocity | High | Medium | No | In progress |
| CMC OOS trend | High | High | Yes | Owner assigned |
| Sole-source supplier | Medium | High | No | Mitigation planned |
| Regulatory submission lag | Medium | Medium | Yes | Resolved |
Escalation triggers for immediate board or regulatory counsel notification: critical supplier failure, major process deviation, clinical hold risk, or any event that shifts a gating uncertainty from medium to high probability within a 90-day window.
Present remediation spend to the board as expected change in cumulative probability and time-to-market improvement — not as a list of technical fixes. A board approves a $3M remediation budget when it sees a 20-percentage-point improvement in deal probability; it hesitates when it sees "CMC process optimization."
How Haiphai identifies and reduces portfolio risk in practice
Haiphai combines uncertainty mapping, targeted diagnostics, and governed AI-enabled workflow redesign to retire gating uncertainties and reclaim operational time. The engagement runs in four phases: diagnostic sprint (2–4 weeks), data ingestion and uncertainty ranking, prioritized remediation with sprinted implementation, and governance handoff with ongoing monitoring.
Clients working with Haiphai have reclaimed up to 18 months of operational time on their path to approval — time that translates directly into valuation and funding leverage at the next financing event.
| Phase | Duration | Deliverable |
|---|---|---|
| Diagnostic sprint | 2–4 weeks | Uncertainty map, top 5 gating risks, data gaps |
| Remediation planning | 4–6 weeks | Prioritized plan with ROI estimates |
| Sprinted implementation | 8 weeks | Redesigned workflows, automated processes |
| Governance handoff | Ongoing | KRI dashboard, board pack cadence, monitoring |
Haiphai's solutions cover the full arc from first diagnostic to embedded operational partnership, with a governance model built for FDA-regulated environments.
What does a 3/6/12-month implementation plan look like?
A focused sequence retires gating uncertainties in the right order rather than spreading effort across every identified risk simultaneously.
| Horizon | Key Deliverables | Quick Wins |
|---|---|---|
| 3 months | Diagnostic sprint complete; uncertainty map built; top 3 gating uncertainties identified; pilot remediation launched on #1 | Fix site activation bottleneck; standardize vendor SLAs |
| 6 months | Scale remediations for top-ranked uncertainties; KRI dashboard live; improved timelines validated with stakeholders | Automate regulatory submission checklists; resolve sole-source supplier gap |
| 12 months | Full governance handoff; integrated risk register; board pack cadence established; validated improvement in cumulative probability | Embedded monitoring; cross-functional risk ownership confirmed |
Key Takeaways
Operational risk identification in a biotech portfolio is most effective when it focuses on gating uncertainties tied to rNPV thresholds, not a comprehensive list of every conceivable risk.
| Point | Details |
|---|---|
| Start with gating uncertainties | Map the single uncertainty per asset that most moves cumulative deal probability if resolved. |
| Use a five-step diagnostic | Set exit thresholds, build inventory, map uncertainties, score impact, rank by cost-of-delay. |
| Board reporting needs ROI framing | Present remediation as expected change in cumulative probability and time-to-market gain. |
| Governance prevents recurrence | Monthly ExCo and quarterly board packs with top 5 gating uncertainties keep remediation on track. |
| Haiphai accelerates execution | Haiphai's embedded diagnostic and AI-enabled workflow redesign has helped clients reclaim up to 18 months of operational time. |
Why operational risk identification is a strategic lever, not a compliance task
Most biotech teams treat risk management as something they do for the board or the auditors. That framing is expensive. When you identify and sequence the retirement of gating uncertainties correctly, you are directly increasing the probability-weighted value of every asset in the portfolio. That is the same lever an acquirer or investor pulls when they discount your valuation at due diligence.
The mindset shift that matters: move from "what could go wrong" to "which uncertainty, resolved now, creates the most value per dollar spent." That reframe changes who owns the risk conversation. It moves from compliance to the CEO and CFO, where it belongs. Haiphai's thought leadership on operating models explores this framing in depth for teams building at scale.
When an operational partner accelerates your risk program
If you cannot re-sequence activities to retire your highest-leverage uncertainties, or you need to convert an uncertainty map into board-ready evidence within a quarter, an embedded operational partner closes that gap faster than building the capability internally.
Haiphai's engagement starts with a diagnostic sprint that delivers your uncertainty map, top gating risks, and a prioritized remediation plan in 2–4 weeks. From there, the team moves directly into sprinted implementation: redesigned workflows, governed AI-enabled automation for regulatory drafting and clinical site activation, and a monitoring cadence your board can track. Clients have reclaimed significant operational time through this process. See how Haiphai's services fit your portfolio's current stage, or explore the sector focus to confirm the fit before you reach out.
FAQ
What is a gating uncertainty in a biotech portfolio?
A gating uncertainty is the single unresolved question that, if answered, most increases the cumulative probability of a deal or financing event for a given asset. It differs from a general risk because it is explicitly tied to investor or acquirer decision criteria.
How do you score operational risks across multiple biotech assets?
Use coarse probability bands (low/medium/high) and ordinal impact tied to timeline delay and rNPV effect, then rank by cost-of-delay per quarter. Consistency across assets matters more than statistical precision.
Which FDA and ICH standards anchor operational risk management in U.S. biotech?
FDA guidance, ICH Q8/Q9(R1)/Q10, GCP, and GMP are the primary anchors. ICH Q9(R1) provides the risk assessment techniques (FMEA, HAZOP, bowtie); Q10 governs the pharmaceutical quality system lifecycle.
How long does a portfolio operational risk diagnostic typically take?
A focused diagnostic sprint covering the top gating uncertainties across a portfolio typically takes 2–4 weeks when the minimum data set (CTMS, ERP, vendor scorecards, regulatory calendar) is accessible.
What outcomes can biotech teams expect from addressing operational risk proactively?
Teams that retire gating uncertainties in the right sequence can improve deal probability, reduce time-to-market, and strengthen valuation at the next financing event. Haiphai clients have reclaimed up to 18 months of operational time on their path to approval.
Useful sources
- Aon Global Risk Management Survey — Life Sciences: Industry survey identifying top cascading operational risks for life sciences organizations; the primary source for supply chain, regulatory, and cyber risk prevalence.
- Biondi — Uncertainty Map for Biotech Asset Value: Practitioner method for identifying and sequencing gating uncertainties tied to rNPV and deal probability; the methodological anchor for the framework in this article.
- Baker Tilly — Enterprise Risk Management for Life Sciences: Governance and lifecycle-aligned ERM guidance for life sciences companies, including integrated risk register design.
- Risk Publishing — Risk Management in Pharmaceutical Companies: Practical five-step FDA-defensible risk program aligned to ICH Q9(R1) and Q10.
- DrugPatentWatch — Pharmaceutical Portfolio Risk Assessment: Investor-focused overview of operational failure modes including enrollment, site performance, and CMC weaknesses.