
Phase advancement is the single most powerful driver of biotech company valuation, triggering discrete, abrupt jumps in value at each clinical milestone rather than producing smooth, incremental growth. Understanding how phase advancement affects biotech valuation is not optional for executives and investors. It is the foundation of every funding decision, licensing negotiation, and portfolio construction strategy in the sector. The industry term for this dynamic is probability-adjusted valuation, most precisely captured through risk-adjusted net present value (rNPV) modeling. This article explains the mechanics, the inflection points, and the strategic implications you need to act on now.
How rNPV models quantify the impact of phase advancement
Risk-adjusted net present value (rNPV) is the standard valuation framework in biotech precisely because it accounts for clinical attrition at each phase. Standard discounted cash flow (DCF) models apply a single discount rate to projected revenues. rNPV goes further by multiplying each future cash flow by the phase-specific probability of success (PoS) before discounting. The result is a valuation that rises materially each time a drug advances to the next phase, because the PoS input increases and the risk-adjusted expected return grows.
The numbers behind this are stark. Phase 1 cumulative PoS sits at roughly 8 to 12%, while Phase 3 cumulative PoS reaches 50 to 55%. That gap means a drug entering Phase 3 carries four to six times the probability-weighted value of the same drug in Phase 1, before any change in peak sales assumptions. For an oncology asset with a $2 billion peak revenue projection, the difference in rNPV between Phase 1 and Phase 3 entry can exceed $400 million on a risk-adjusted basis.

The rNPV formula also incorporates development costs at each phase and a discount rate that reflects the time value of money and capital cost. A typical oncology Phase 1 program might carry $20 to $40 million in development costs and a 12 to 15% discount rate. As the asset advances and those costs are sunk, the forward-looking cost burden shrinks while the PoS rises. Both forces push rNPV upward simultaneously, which is why phase transitions create such pronounced valuation inflection points.
Pro Tip: When building an rNPV model, use therapeutic area-specific PoS rates rather than industry averages. Oncology Phase 2 PoS runs significantly lower than rare disease Phase 2 PoS, and conflating the two will systematically misprice your asset.
Understanding rNPV inputs for biotech requires matching phase-specific probabilities to the actual therapeutic area and mechanism of action, not just the phase label.
What are the major clinical phase inflection points and their valuation effects?
Valuation jumps occur at discrete milestones: IND filing, Phase 1 safety readout, Phase 2 proof-of-concept, Phase 3 pivotal data, NDA filing, and regulatory approval. Each event removes a specific category of risk and shifts the rNPV calculation upward. The magnitude of each jump is not uniform.
The most consequential single event in most programs is the Phase 2 proof-of-concept readout. Here is why the major inflection points stack up:
- IND clearance: Removes regulatory filing risk and confirms the FDA has accepted the clinical development plan. Valuation impact is moderate but meaningful, particularly for novel mechanisms where IND acceptance was uncertain.
- Phase 1 safety readout: Confirms the drug is tolerable in humans. For oncology and CNS programs, this is often the first human validation event and can double early-stage valuations in private markets.
- Phase 2 proof-of-concept: The highest-risk transition in the entire development arc. The Phase 2 to Phase 3 transition carries only a 35% overall probability of success, and nearly half of all valuation attrition in drug development occurs at this single gate. A positive Phase 2 readout can double or triple probability-adjusted value overnight.
- Phase 3 pivotal data: Small improvements in Phase 3 success probabilities can increase rNPV by 30 to 50%. Phase 3 data functions as the primary thesis validation event for institutional investors and acquirers.
- NDA filing: Phase 3 to NDA filing carries roughly 60% probability. Filing itself signals that the sponsor believes the data package is complete, which triggers another valuation step-up.
- Regulatory approval: NDA to approval runs at 85 to 90% probability. The valuation jump here is real but smaller in percentage terms than earlier transitions, because most of the risk was already removed at Phase 3.
The "Phase 2 cliff" deserves particular attention. A failed Phase 2 is extremely difficult to refinance. The pre-inflection window of 12 to 36 months before a major readout is the most fragile period in a biotech's financial life. Companies that run out of capital in this window rarely recover.
How phase advancement influences funding strategies and deal economics
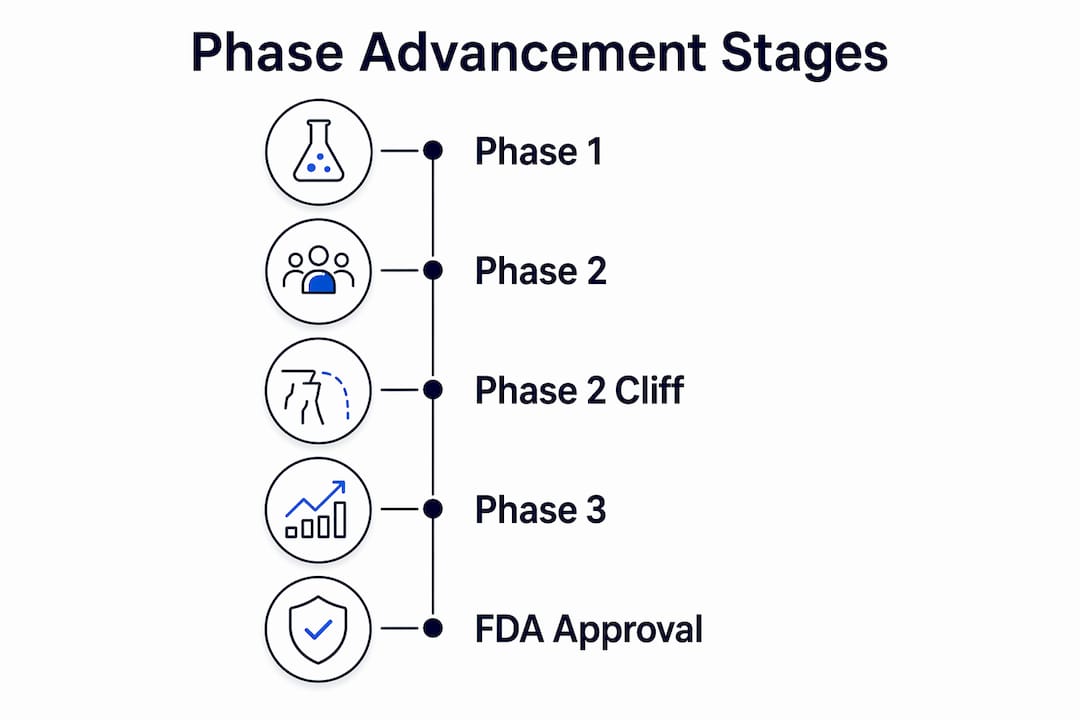
Clinical progress directly determines the terms a biotech can command in financing rounds and licensing transactions. This relationship is quantifiable, not just directional. Median upfront payments in licensing deals scale dramatically with phase: $10 million for Phase 1, $50 million for Phase 2, and $150 million for Phase 3 deals, based on 2026 benchmarks. That 15-fold increase from Phase 1 to Phase 3 reflects the risk reduction the licensor has already absorbed.
Venture capital behavior follows the same logic, but with a forward-looking twist. Smart capital allocation in biotech follows this sequence:
- Identify the binding phase gate. The binding gate is the transition with the highest attrition probability for a specific asset. For most programs, this is Phase 2. Allocating capital to maximize the quality of the Phase 2 trial design, endpoint selection, and patient population is the highest-return investment a company can make before that gate.
- Tranche capital to milestone events. Smart tranching and milestone-based draws align investor capital deployment to value-creating events. A Series B structured with a $30 million initial draw and a $50 million milestone draw tied to Phase 2 initiation protects investors while giving the company a clear runway to the next inflection point.
- Design parallel exit paths. Companies that construct simultaneous paths to IPO, strategic partnership, and M&A from Series A onward command better terms at every stage. Optionality itself has value in the rNPV framework because it reduces the probability of a forced sale at a distressed valuation.
- Time licensing conversations to precede inflection points. Licensing a Phase 2 asset before the readout transfers risk to the partner but captures a premium over Phase 1 pricing. Waiting for Phase 2 data and licensing at Phase 3 entry captures the full upfront premium but requires the company to carry the Phase 2 risk on its own balance sheet.
Pro Tip: Capital markets increasingly demand Phase 1 clinical data with credible paths to later phases and commercial readiness, effectively moving valuation inflection earlier. Build your Phase 1 protocol with Phase 2 endpoint selection in mind from day one.
Common pitfalls when valuing biotech by phase advancement
The most dangerous mistake in biotech valuation is treating phase advancement as a smooth, linear process. Linear valuation models fail to capture the discrete nature of clinical inflection points, which leads to mistimed financing rounds and mispriced assets in both directions.
"Each phase gate milestone changes not only clinical risk but also financing leverage, shifting market participant valuation frameworks in ways that standard models cannot anticipate." This is why biotech valuations can appear to defy conventional financial logic to observers trained on industrial or technology company analysis.
Several specific pitfalls recur across the sector. First, using static PoS rates rather than updating them with Bayesian evidence as new data emerges. A Phase 2 trial that shows strong biomarker signals at an interim analysis should trigger an upward revision to the Phase 2 success probability, which flows directly into a higher rNPV. Companies that fail to update their models miss the opportunity to raise capital at improved terms before the final readout.
Second, ignoring manufacturing and commercial readiness as de-risking factors. A drug with a scalable manufacturing process and a defined commercial pathway carries lower total development risk than an equivalent drug with unresolved chemistry, manufacturing, and controls (CMC) issues. Sophisticated acquirers and licensors price this difference. A Phase 2 asset with a clean CMC package and a validated biomarker strategy can command Phase 3 pricing in a licensing negotiation.
Third, from 1,357 VC-backed Phase 1 trials between 2006 and 2015, only 14.1% ultimately gained FDA approval. That means 85.9% of Phase 1 assets never reached approval. Portfolio managers who allocate capital as if their Phase 1 assets have average PoS rates are systematically overvaluing their portfolios. Applying therapeutic area-specific attrition data and updating it with program-specific evidence is the only defensible approach.
Fourth, positive Phase 2 readouts can double or triple probability-adjusted value and require immediate 409A valuation updates for private companies. Failing to update 409A valuations after material clinical events creates legal and tax exposure that compounds over time.
Key takeaways
Phase advancement drives biotech valuation through discrete, probability-weighted inflection points, and the Phase 2 proof-of-concept readout carries the highest single-event impact on company value across the entire development arc.
| Point | Details |
|---|---|
| rNPV is the standard model | Phase-specific PoS inputs drive valuation; Phase 3 PoS is four to six times higher than Phase 1. |
| Phase 2 cliff dominates risk | Only 35% of programs transition from Phase 2 to Phase 3, making this the highest-attrition gate. |
| Deal economics scale with phase | Median licensing upfronts rise from $10M at Phase 1 to $150M at Phase 3 in 2026 benchmarks. |
| Linear models misprice assets | Discrete inflection points require milestone-aware valuation frameworks, not smooth DCF curves. |
| Capital tranching protects value | Milestone-based draws align investor capital to value-creating events and reduce pre-inflection fragility. |
Why the Phase 2 cliff is the real test of biotech strategy
After working with biotech executives and investors across multiple development cycles, the pattern I keep returning to is this: most valuation mistakes are not modeling errors. They are strategic errors that show up in the model.
The teams that consistently maximize value at phase transitions are the ones that treat Phase 2 design as a financing decision, not just a clinical one. They ask: what endpoint, in what patient population, with what biomarker strategy, will produce data that a Phase 3 partner or acquirer will pay a premium for? That question reframes the entire trial design conversation. It forces alignment between clinical, regulatory, and business development teams before the trial starts, not after the readout.
The companies that struggle are the ones that run Phase 2 trials designed to answer internal scientific questions rather than external commercial ones. They generate interesting data that does not translate into a clean Phase 3 hypothesis, and they find themselves in the worst possible position: a positive signal that no partner will pay Phase 3 prices for.
The other lesson I keep seeing confirmed is that optionality is undervalued in early-stage biotech. Building parallel paths to IPO, partnership, and M&A from the start is not hedging. It is the only rational response to the pre-inflection fragility that every biotech faces in the 12 to 36 months before a major readout. The companies that build those paths early have leverage. The ones that do not are negotiating from a position of necessity, and counterparties price that weakness immediately.
Capital efficiency matters more than ever in the current funding environment. The teams that identify their binding phase gate early, allocate disproportionate resources to maximizing the quality of that single transition, and structure their capital draws around it will consistently outperform teams that spread resources evenly across the pipeline.
— John
How Haiphai helps you model phase advancement and protect valuation
Operational delays are one of the most underappreciated destroyers of biotech value. Every month lost between a positive Phase 2 readout and a Phase 3 IND submission is a month of rNPV erosion, a month of competitive exposure, and a month of investor patience consumed.

Haiphai acts as an operational partner for biotech teams, starting from your strategic valuation goals and working backward to identify the bottlenecks that are compressing your timeline to the next inflection point. By integrating AI across regulatory drafting, clinical site activation, and milestone tracking, Haiphai clients reclaim up to 18 months of operational time on the path to approval. For a Phase 2 asset with a $500 million rNPV at Phase 3 entry, 18 months of recovered time is not an operational metric. It is a valuation outcome. Explore how Haiphai's AI platform can help your team reach the next phase gate faster and with greater capital efficiency.
FAQ
What is rNPV and why does it matter for biotech valuation?
Risk-adjusted net present value (rNPV) multiplies projected cash flows by phase-specific probabilities of success before discounting, producing a valuation that rises with each phase advancement. It is the standard framework for biotech because it captures clinical attrition risk that standard DCF models ignore.
Which clinical phase transition has the biggest impact on valuation?
The Phase 2 to Phase 3 transition carries the largest single impact, with only a 35% overall success probability and nearly half of all valuation attrition occurring at this gate. A positive Phase 2 proof-of-concept readout can double or triple a company's probability-adjusted value.
How does phase advancement affect licensing deal terms?
Median upfront licensing payments scale from $10 million at Phase 1 to $50 million at Phase 2 and $150 million at Phase 3, reflecting the risk reduction the licensor has absorbed through clinical advancement.
When should a biotech update its 409A valuation?
A 409A valuation update is required after any material clinical event, including Phase 2 readouts, regulatory filings, and approval decisions. A positive Phase 2 readout can double or triple probability-adjusted value, creating significant legal and tax exposure if the 409A is not updated promptly.
How do VCs use phase advancement to structure investments?
VCs align capital deployment to phase milestones through tranched financing, where initial draws fund operations to the next inflection point and milestone-based draws are triggered by successful phase transitions. This structure protects capital while maximizing exposure to valuation step-ups.