
Biotech portfolio timeline benchmarks are defined as integrated measures combining phase-specific calendar duration standards with phase-to-phase transition probabilities to produce realistic, value-weighted development expectations. These benchmarks draw from sources like Ambrosia Ventures' rNPV framework, FDA review timing data, and licensing deal datasets covering thousands of biopharma transactions. Executives who rely on calendar dates alone systematically underestimate attrition risk and overvalue early-stage assets. The benchmarks covered here give you a data-grounded framework for milestone planning, portfolio prioritization, and investor communication across every stage of development.
1. Standard phase duration benchmarks every portfolio needs
The typical clinical phase durations are Phase 1 at 1 to 2 years, Phase 2 at 2 to 3 years, and Phase 3 at 2 to 3 years. Phase 3 carries the longest execution risk window because it involves large, multi-site trials that are highly sensitive to enrollment delays and protocol amendments. These ranges form the baseline calendar layer of any credible portfolio biotech milestone tracking guide.
Before any clinical phase begins, preclinical work and IND submission typically consume 3 to 6 years. The full drug development timeline averages 10 to 15 years from discovery to approval, with FDA review of an NDA taking only 10 to 12 months. That means regulatory review represents less than 10% of total development time. Executives who anchor their timeline expectations to FDA review speed are measuring the wrong variable.
- Preclinical and IND: 3 to 6 years
- Phase 1: 1 to 2 years (safety and dosage validation)
- Phase 2: 2 to 3 years (efficacy and dosing confirmation)
- Phase 3: 2 to 3 years (large-scale safety and efficacy confirmation)
- NDA/BLA submission and FDA review: 10 to 12 months
Pro Tip: Build a minimum 20% time contingency into Phase 2 and Phase 3 timelines specifically for site activation delays and FDA information requests. These two events account for the majority of unplanned schedule extensions in late-stage programs.
2. How phase transition probabilities reshape timeline expectations

Calendar ranges describe when phases end. Transition probabilities describe whether they end in advancement. VC-backed programs reach FDA approval at a rate of only 14.1% from Phase 1, with 42.5% of programs stopping after Phase 2. That single statistic reframes every portfolio timeline conversation: most assets you are tracking will not reach Phase 3.
The phase-to-phase transition rates that define realistic biotech funding stage indicators are:
- Phase 1 to Phase 2: approximately 65% advance
- Phase 2 to Phase 3: approximately 35%, the well-documented "Phase 2 cliff"
- Phase 3 to NDA submission: approximately 60%
- NDA to approval: approximately 85 to 90%
The cumulative probability of success from Phase 1 is roughly 8 to 12%, depending on therapeutic area and modality. This compounding attrition is why probability-weighted timelines diverge so sharply from calendar-only projections. An asset that looks 4 years from approval on a Gantt chart may carry an expected time-to-approval of 12 years once attrition is factored in.
Complete response letters from the FDA can add 1 to 3 years of tail risk beyond NDA submission. Teams that benchmark only to NDA submission are leaving a material risk window unmeasured. Any biotech valuation timeline that stops at submission is incomplete.
Pro Tip: Replace single fixed milestone dates with expected-time-to-next-decision-gate calculations. Weight each gate by the probability of reaching it, and you will produce a far more defensible timeline for board presentations and investor updates.
3. Therapeutic area benchmarks: why oncology and rare disease differ
Therapeutic area is one of the strongest predictors of timeline length and deal structure. Oncology accounts for roughly 30% of biopharma deals and carries the highest median total potential deal value at $1.8 billion. That premium reflects longer, denser milestone timelines and the complexity of demonstrating survival benefit in large patient populations. Cancer-related trials carry an FDA approval rate of approximately 8.7%, well below the 14.1% average across all indications.
Rare disease programs operate on a different curve. Smaller trial sizes and accelerated regulatory pathways like Breakthrough Therapy Designation and Orphan Drug status compress clinical timelines. Upfront-to-total-value ratios in rare disease deals tend to be higher because partners price in the lower execution risk of smaller, faster trials. Infectious disease programs sit between these extremes, with higher progression rates than oncology but less favorable deal structures than rare disease.
| Therapeutic area | Typical Phase 3 duration | FDA approval rate | Deal structure emphasis |
|---|---|---|---|
| Oncology | 3 to 5 years | ~8.7% | Milestone-heavy, high total value |
| Rare disease | 1 to 3 years | Above average | Higher upfront ratio |
| Infectious disease | 2 to 3 years | Above average | Balanced upfront and milestones |
Applying a single timeline benchmark across these categories produces systematic errors in portfolio ranking. An oncology asset at Phase 2 and a rare disease asset at Phase 2 are not equivalent risks or equivalent timeline positions, even if they share the same calendar date for expected Phase 3 initiation.
4. Drug modality and its impact on progression rates
Biologics progress to Phase 3 and FDA approval at lower rates than small molecules. Cell and gene therapies carry the most variable timelines of any modality, driven by manufacturing complexity, novel safety signals, and evolving regulatory frameworks. Small molecules benefit from decades of established development infrastructure, which compresses Phase 1 and Phase 2 timelines relative to newer modalities.
For a biotech milestone planning guide to be accurate, it must normalize for modality. A gene therapy program benchmarked against small molecule phase durations will appear perpetually behind schedule. The real problem is not execution. It is the wrong benchmark. Haiphai's approach to portfolio planning starts from this distinction, working backward from modality-specific probability data to identify where operational bottlenecks are actually costing time versus where the science simply requires it.
Licensing deal structures also reflect modality risk. Milestone payments for cell and gene therapy deals are typically back-loaded, with larger payments tied to Phase 3 completion and commercial launch rather than Phase 2 readouts. This structure signals how partners price the elevated execution uncertainty of these modalities into deal economics.
5. Applying timeline benchmarks to portfolio optimization and fundraising
Biotech fundraising timeline checklists that ignore transition probabilities produce valuations that do not survive investor scrutiny. The practical application of biotech portfolio timeline benchmarks starts with calibrating your rNPV model using both phase duration ranges and probability-weighted advancement rates. A 10-point improvement in Phase 3 transition probability can raise rNPV by 30 to 50%. That is a larger value lever than cutting six months from a Phase 2 timeline.
For portfolio-level decision-making, apply these practices:
- Gate decisions on quality, not just dates. An asset that hits its Phase 2 completion date with weak efficacy signals destroys more value than one that runs three months long with clean data.
- Align fundraising rounds to decision gates. Raise capital when you are 12 to 18 months from a high-probability Phase 2 readout, not after it. Investors price pre-data risk differently than post-data uncertainty.
- Use licensing deal benchmarks to set negotiation floors. Updated biopharma licensing benchmarks covering 1,900-plus deals give you defensible upfront and milestone ranges by phase and therapeutic area.
- Communicate timeline risk explicitly. Investors who understand your Phase 2 to Phase 3 transition probability are better partners than those who believe your Gantt chart.
- Track time-to-next-gate, not time-to-approval. Near-term decision gates are measurable and manageable. Ten-year approval timelines are not.
Pro Tip: When negotiating licensing terms, reference current deal benchmarks by phase and indication. Upfront payments for Phase 2 oncology assets differ materially from Phase 1 rare disease assets. Using the wrong comparator costs real money at the negotiating table.
A well-structured LIMS implementation timeline also feeds directly into milestone accuracy. Data systems that cannot produce clean, audit-ready outputs at decision gates create regulatory delays that no probability model can absorb.
6. Portfolio-level risk communication using benchmark data
Executives often underestimate how much portfolio-wide phase transition uncertainty affects aggregate value. Improving transition odds at any phase dramatically increases portfolio value, which means timeline benchmarks are not just planning tools. They are valuation inputs that belong in every board deck and investor update.
Risk communication built on benchmark data should separate three distinct timeline layers. The first is execution risk, which covers site activation, enrollment, and protocol compliance. The second is scientific risk, which covers the probability that the drug works as hypothesized. The third is regulatory risk, which covers FDA review timing and the possibility of a complete response letter. Most portfolio reviews conflate all three into a single timeline, which obscures where management can actually intervene.
Separating these layers also improves research workflow planning and data security practices, both of which affect how cleanly a program can move through a decision gate. Sloppy data management at Phase 2 creates regulatory friction at Phase 3, adding months that no benchmark predicted.
Key takeaways
Biotech portfolio timeline benchmarks require combining phase duration ranges, transition probabilities, and modality-specific data to produce valuations and milestone plans that hold up under investor scrutiny.
| Point | Details |
|---|---|
| Phase durations are baselines, not guarantees | Phase 1 to Phase 3 spans 5 to 8 years of calendar time before FDA review even begins. |
| The Phase 2 cliff is the primary attrition driver | Only 35% of programs advance from Phase 2 to Phase 3, making this gate the most critical value decision. |
| Modality and indication require separate benchmarks | Oncology and gene therapy timelines differ enough from rare disease that shared benchmarks produce systematic ranking errors. |
| Quality at decision gates drives more value than speed | A 10-point Phase 3 transition improvement raises rNPV by 30 to 50%, outweighing most schedule optimizations. |
| Fundraising should align to decision gate timing | Raising capital 12 to 18 months before a high-probability readout maximizes valuation and investor confidence. |
Timeline benchmarks are only as good as the data behind them
Most portfolio reviews I have seen treat phase duration ranges as the primary planning input and treat transition probabilities as a footnote. That is exactly backward. The calendar tells you when a decision will happen. The probability tells you whether it will matter. Getting that sequence wrong leads to over-investment in late-stage assets with deteriorating data packages and under-investment in Phase 1 programs with genuinely differentiated mechanisms.
The other mistake I see repeatedly is treating FDA review timing as a proxy for total development risk. The FDA's 10 to 12-month review window is one of the most predictable parts of the entire process. What is unpredictable is the quality of the NDA package you submit, which is a function of decisions made two to four years earlier in Phase 2. Executives who obsess over FDA timelines while tolerating weak Phase 2 endpoints are optimizing the wrong variable.
Therapeutic area normalization matters more than most teams acknowledge. I have watched oncology programs get deprioritized because they appeared slow relative to a rare disease asset in the same portfolio. The comparison was meaningless without normalizing for the structural differences in trial design, enrollment complexity, and regulatory pathway. Benchmarks without context produce bad decisions faster than no benchmarks at all.
The most durable portfolio management practice I have seen is replacing fixed milestone dates with probability-weighted time-to-next-gate estimates, updated at every major data readout. It forces honest conversations about scientific risk and keeps capital allocation tied to evidence rather than optimism.
— John
How Haiphai helps you act on these benchmarks
Biotech portfolio timeline benchmarks are only useful when your operational systems can actually execute against them. Haiphai works as an operational partner for life sciences teams, starting from your strategic goals and working backward to identify where process bottlenecks are eroding your timeline and your valuation.
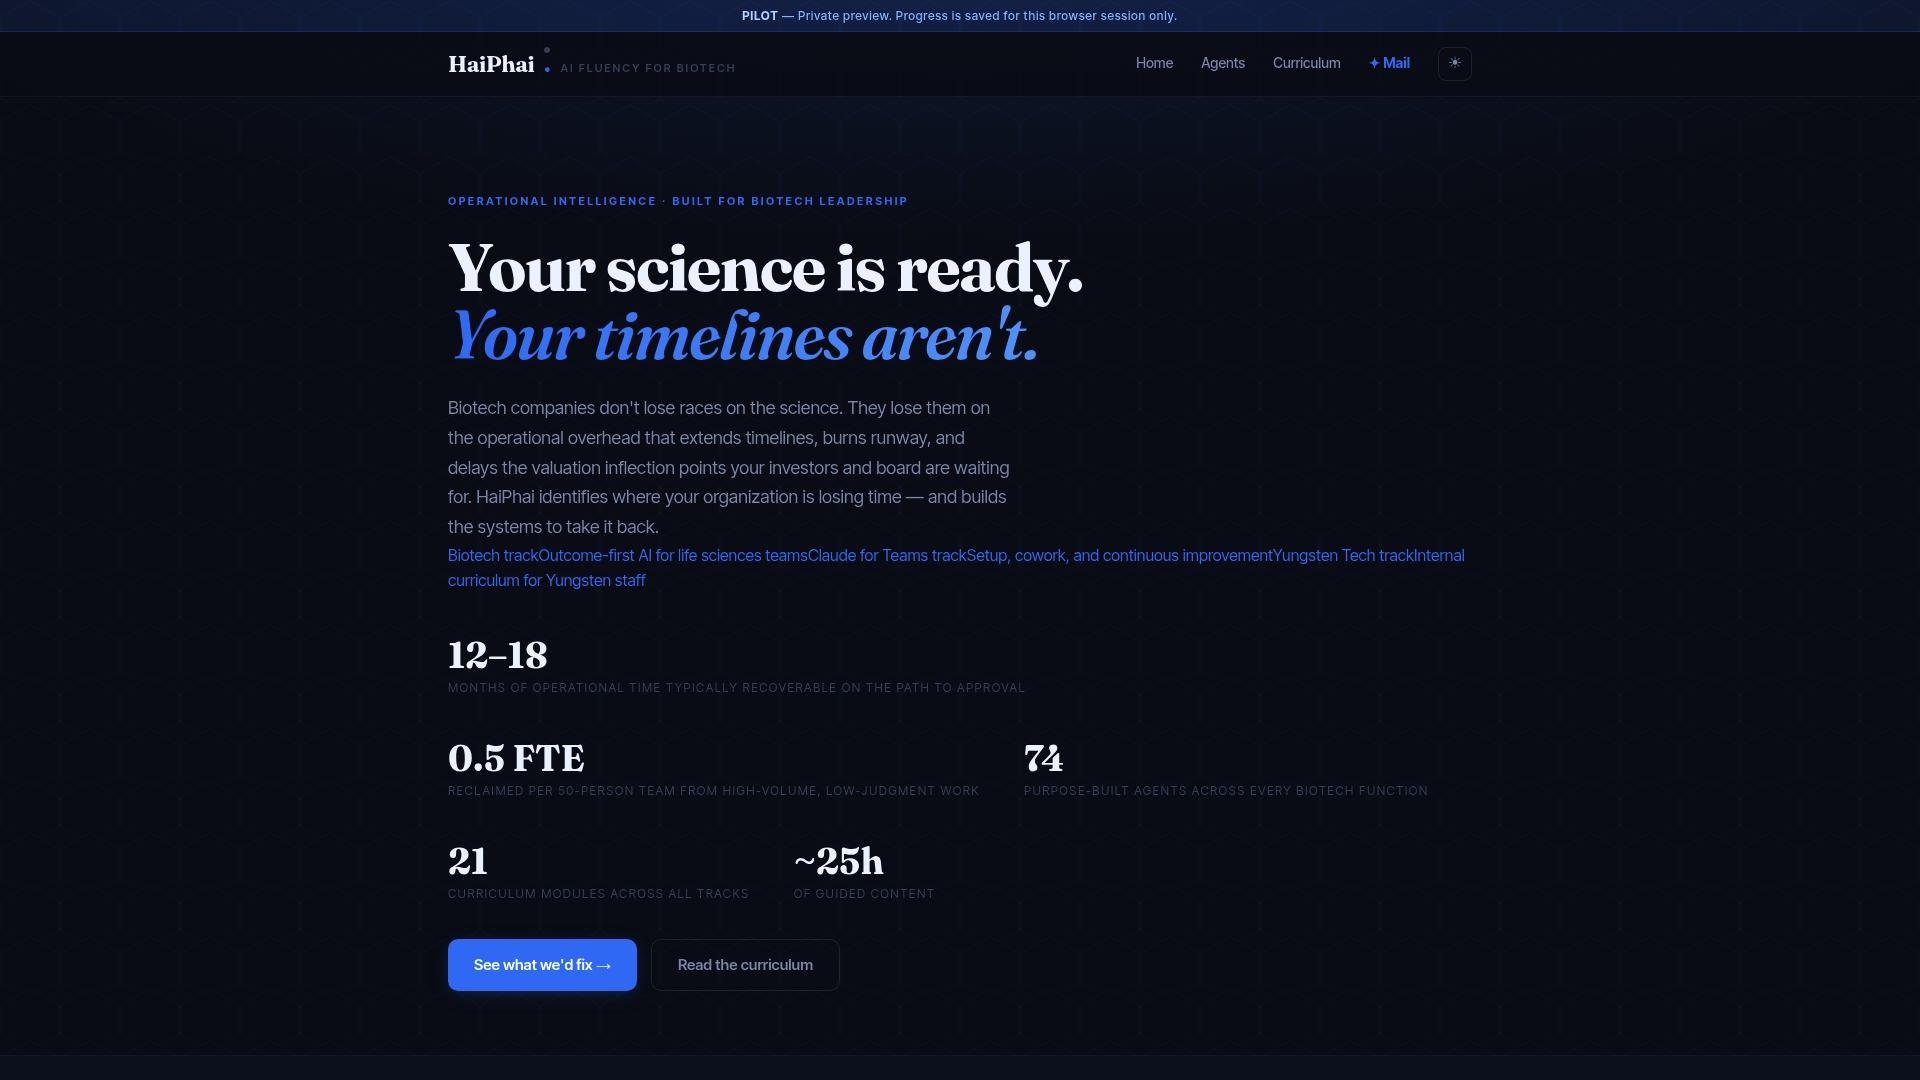
Haiphai integrates AI into regulatory drafting, clinical site activation, and milestone tracking to help teams reclaim up to 18 months of operational time on the path to approval. That is not a scheduling improvement. It is a valuation event. If your portfolio is carrying timeline risk that comes from operational friction rather than scientific uncertainty, explore Haiphai to see where the time is actually going.
FAQ
What are biotech portfolio timeline benchmarks?
Biotech portfolio timeline benchmarks are integrated measures combining phase-specific calendar duration ranges with phase-to-phase transition probabilities to produce realistic, probability-weighted development timelines. They draw from clinical phase data, FDA review timing, and licensing deal benchmarks to support portfolio valuation and milestone planning.
How long does each clinical phase take on average?
Phase 1 typically takes 1 to 2 years, Phase 2 takes 2 to 3 years, and Phase 3 takes 2 to 3 years. Total drug development from discovery to FDA approval averages 10 to 15 years, with FDA review representing only 10 to 12 months of that total.
What is the Phase 2 cliff in biotech development?
The Phase 2 cliff refers to the approximately 35% Phase 2 to Phase 3 transition rate, which is the single largest attrition point in clinical development. It means roughly 65% of programs that enter Phase 2 do not advance to Phase 3, making Phase 2 gate quality the most consequential decision in portfolio management.
How do therapeutic area differences affect timeline benchmarks?
Oncology programs carry longer, milestone-dense timelines and an FDA approval rate of approximately 8.7%, compared to the 14.1% average across all indications. Rare disease programs benefit from smaller trials and accelerated regulatory pathways, producing shorter clinical timelines and higher upfront-to-total-value ratios in licensing deals.
How should biotech executives use transition probabilities in fundraising?
Executives should align fundraising rounds to high-probability decision gates rather than fixed calendar dates. A 10-point improvement in Phase 3 transition probability can raise rNPV by 30 to 50%, making transition probability management a more powerful valuation lever than schedule compression alone.